


 571 / 730

A subsidiary of a ranked company |
Company shares are traded in Israel |
Company shares are traded abroad |
Estimated figures
Cities over 200,000 inhabitants
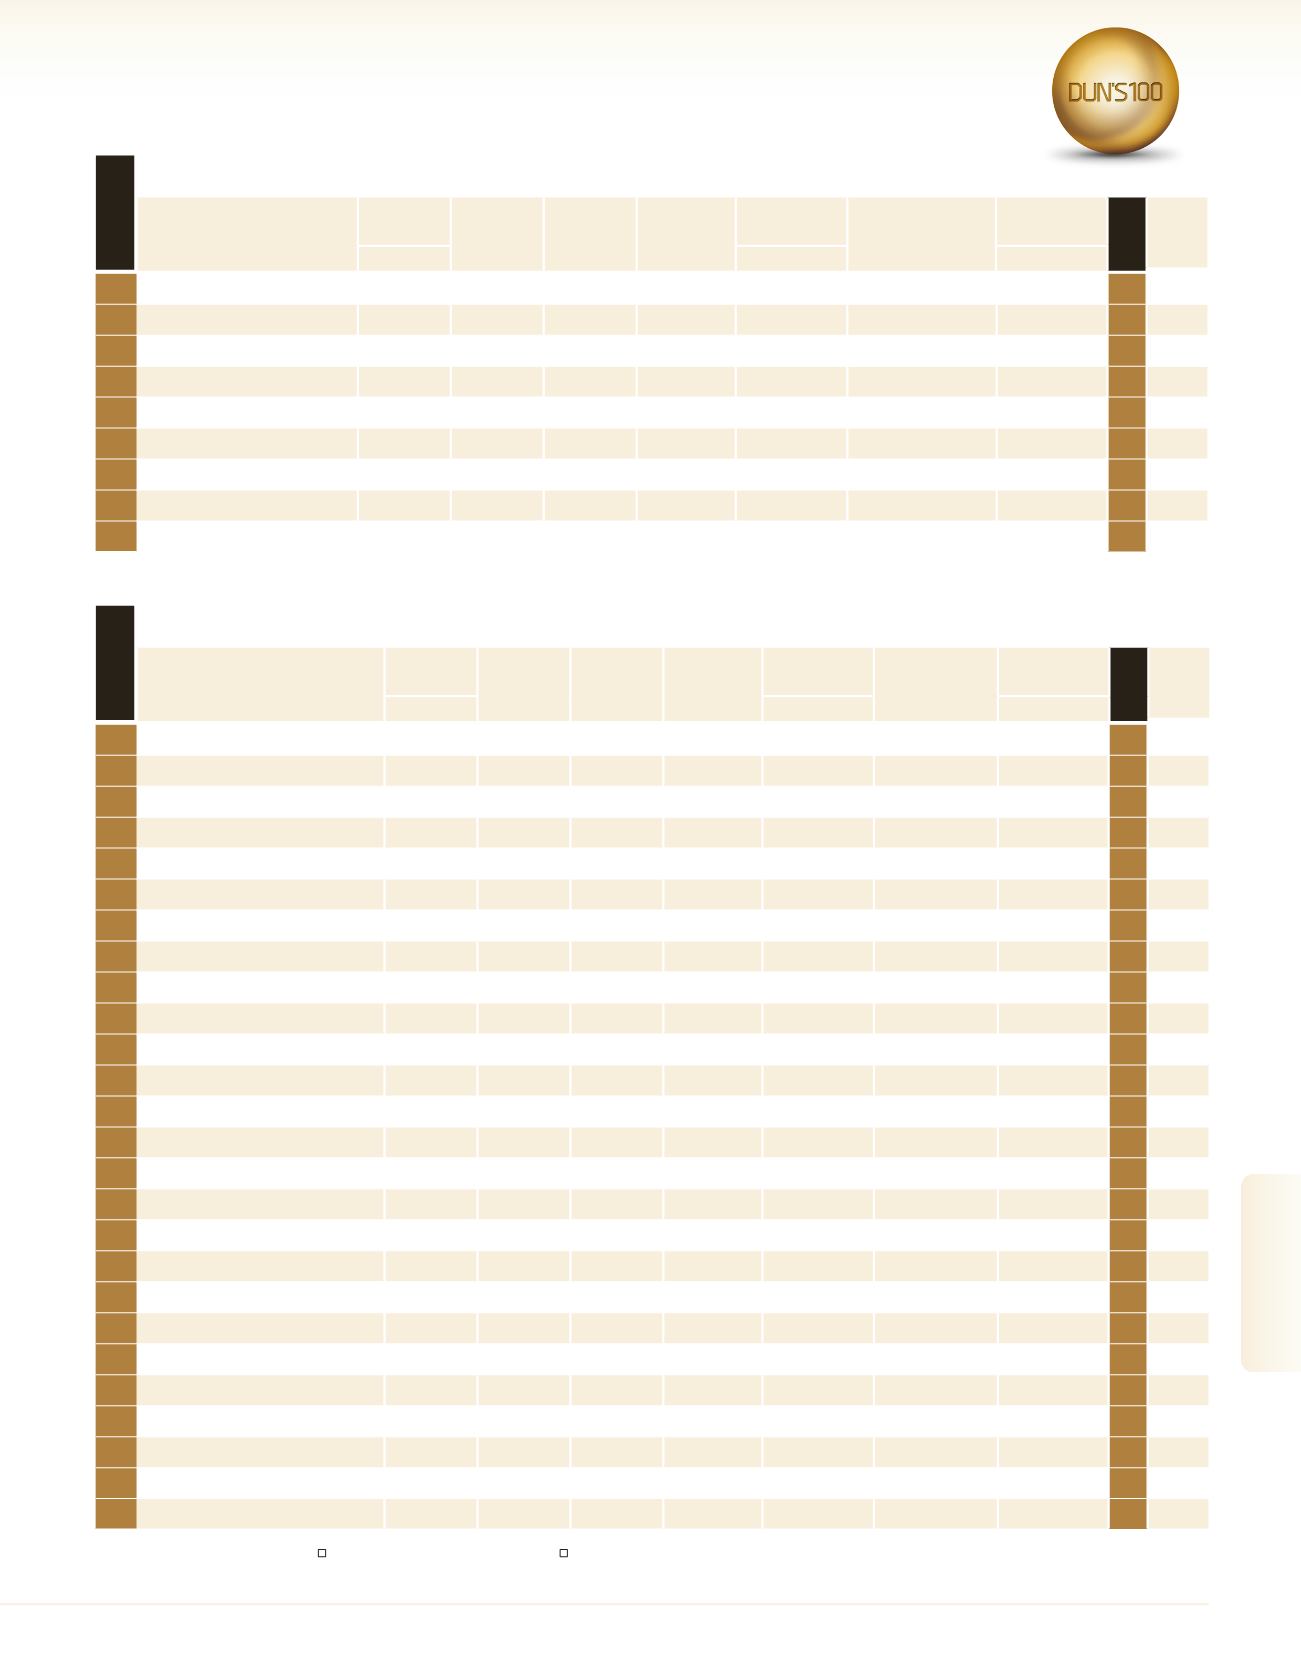
1
Municipality of Tel Aviv-Yafo
4,273.0
0.3
0.95
4.0
0.03
8
510,274
1
2
Municipality of Rishon LeZion
1,522.4
0.3
0.91
9.1
–
6
256,866
2
3
Municipality of Holon
1,060.3
0.2
0.93
11.3
0.04
5
205,046
3
4
Municipality of Netanya
1,597.5
0.2
0.90
11.6
0.16
5
228,610
7
5
Municipality of Petach Tikva
1,494.7
0.0
0.91
10.5
0.07
6
245,731
4
575
6
Municipality of Be’er-Sheva
1,344.0
0.1
0.91
15.4
0.93
5
212,059
6
7
Municipality of Haifa
2,445.0
0.1
0.86
9.7
19.05
7
313,590
5
8
Municipality of Ashdod
1,313.7
0.1
0.94
16.7
1.46
5
243,490
8
9
Municipality of Jerusalem
4,563.3
-0.0
0.85
14.7
6.65
4
913,581
9
City
Income
Regular
Budget
Balance/
Deficit Rate
(%) of Regular
Budget
Percentage
of property
tax collection
The ratio of
residents to
businesses
Ratio of
grants to total
regular budget
Socioeconomic
rating
Population
Rank 2015
Profile
NIS Millions
%
No.
See Page
rank 2016
Cities 50,000-200,000 inhabitants
1
Municipality of Herzliya
795.7
1.3
0.86
5.5
0.04
8
101,302
1
2
Municipality of Kfar Saba
642.9
0.3
0.95
8.0
0.04
8
101,643
2
3
Municipality of Hod Hasharon
369.2
0.7
0.90
7.1
0.06
8
55,426
3
576
4
Municipality of Ra’anana
674.3
0.2
0.96
6.9
1.16
8
83,501
11
5
Municipality of Ramat Gan
1,050.5
0.0
0.91
4.4
0.30
7
157,662
4
6
Municipality of Givatayim
340.7
0.0
0.94
7.6
0.09
8
59,516
5
7
Municipality of Eilat
507.9
-0.7
0.94
9.7
4.62
5
63,257
8
8
Municipality of Ashkelon
752.0
0.1
0.93
15.3
1.65
5
137,891
7
9
Municipality of Modi’in-Maccabim-Reut
463.6
0.0
0.97
17.9
0.03
8
88,109
9
10
Municipality of Lod
391.9
7.3
0.88
17.8
10.95
4
78,558
13
11
Municipality of Bat Yam
757.3
0.1
0.94
16.3
5.70
5
157,358
14
12
Municipality of Kiryat Ata
342.3
0.2
0.88
15.7
6.24
5
59,049
12
577
13
Municipality of Carmiel
260.1
0.0
0.91
15.1
3.31
5
52,084
6
14
Municipality of Hadera
541.6
-1.2
0.89
11.8
0.14
5
93,605
17
15
Municipality of Rehovot
863.4
-2.4
0.88
10.5
0.43
6
137,761
10
16
Municipality of Nahariya
370.0
-0.8
0.88
14.3
10.49
5
62,467
20
17
Municipality of Bnei Brak
1,081.8
-0.1
0.88
14.6
14.88
3
185,935
15
578
18
Municipality of Rahat
232.7
3.1
0.73
34.6
11.36
2
56,325
24
19
Municipality of Ramla
429.6
-0.7
0.89
16.9
10.14
4
76,864
19
20
Municipality of Kiryat Gat
412.9
-4.1
0.94
19.1
7.52
4
55,280
18
21
Municipality of Nazareth
283.1
-4.6
0.59
11.2
11.54
3
79,591
21
22
Municipality Of Um El Fahem
252.6
-3.7
0.78
15.2
10.56
2
51,952
25
23
Municipality of Akko
341.4
-5.2
0.85
16.9
14.16
4
54,666
16
24
Municipality of Nazareth Elit
261.9
-4.5
0.83
19.7
4.29
5
50,104
23
25
Municipality of Modi’in Illit
216.2
-0.9
0.82
46.5
19.39
1
64,307
22
26
Municipality of Beit Shemesh
354.8
-5.8
0.86
23.7
13.21
3
103,570
26
City
Income
Regular
Budget
Balance/
Deficit Rate
(%) of Regular
Budget
Percentage
of property
tax collection
The ratio of
residents to
businesses
Ratio of
grants to total
regular budget
Socioeconomic
rating
Population
Rank 2015
Profile
NIS Millions
%
No.
See Page
rank 2016
Local Authorities
571
2016
|
DUN’S
100
DUN’S
100
|
2016
DUN’S
100
|
2016
2016
|
DUN’S
100
Local Authorities