


 31 / 74

A subsidiary of a ranked company |
Company shares are traded in Israel |
Company shares are traded abroad |
Estimated figures
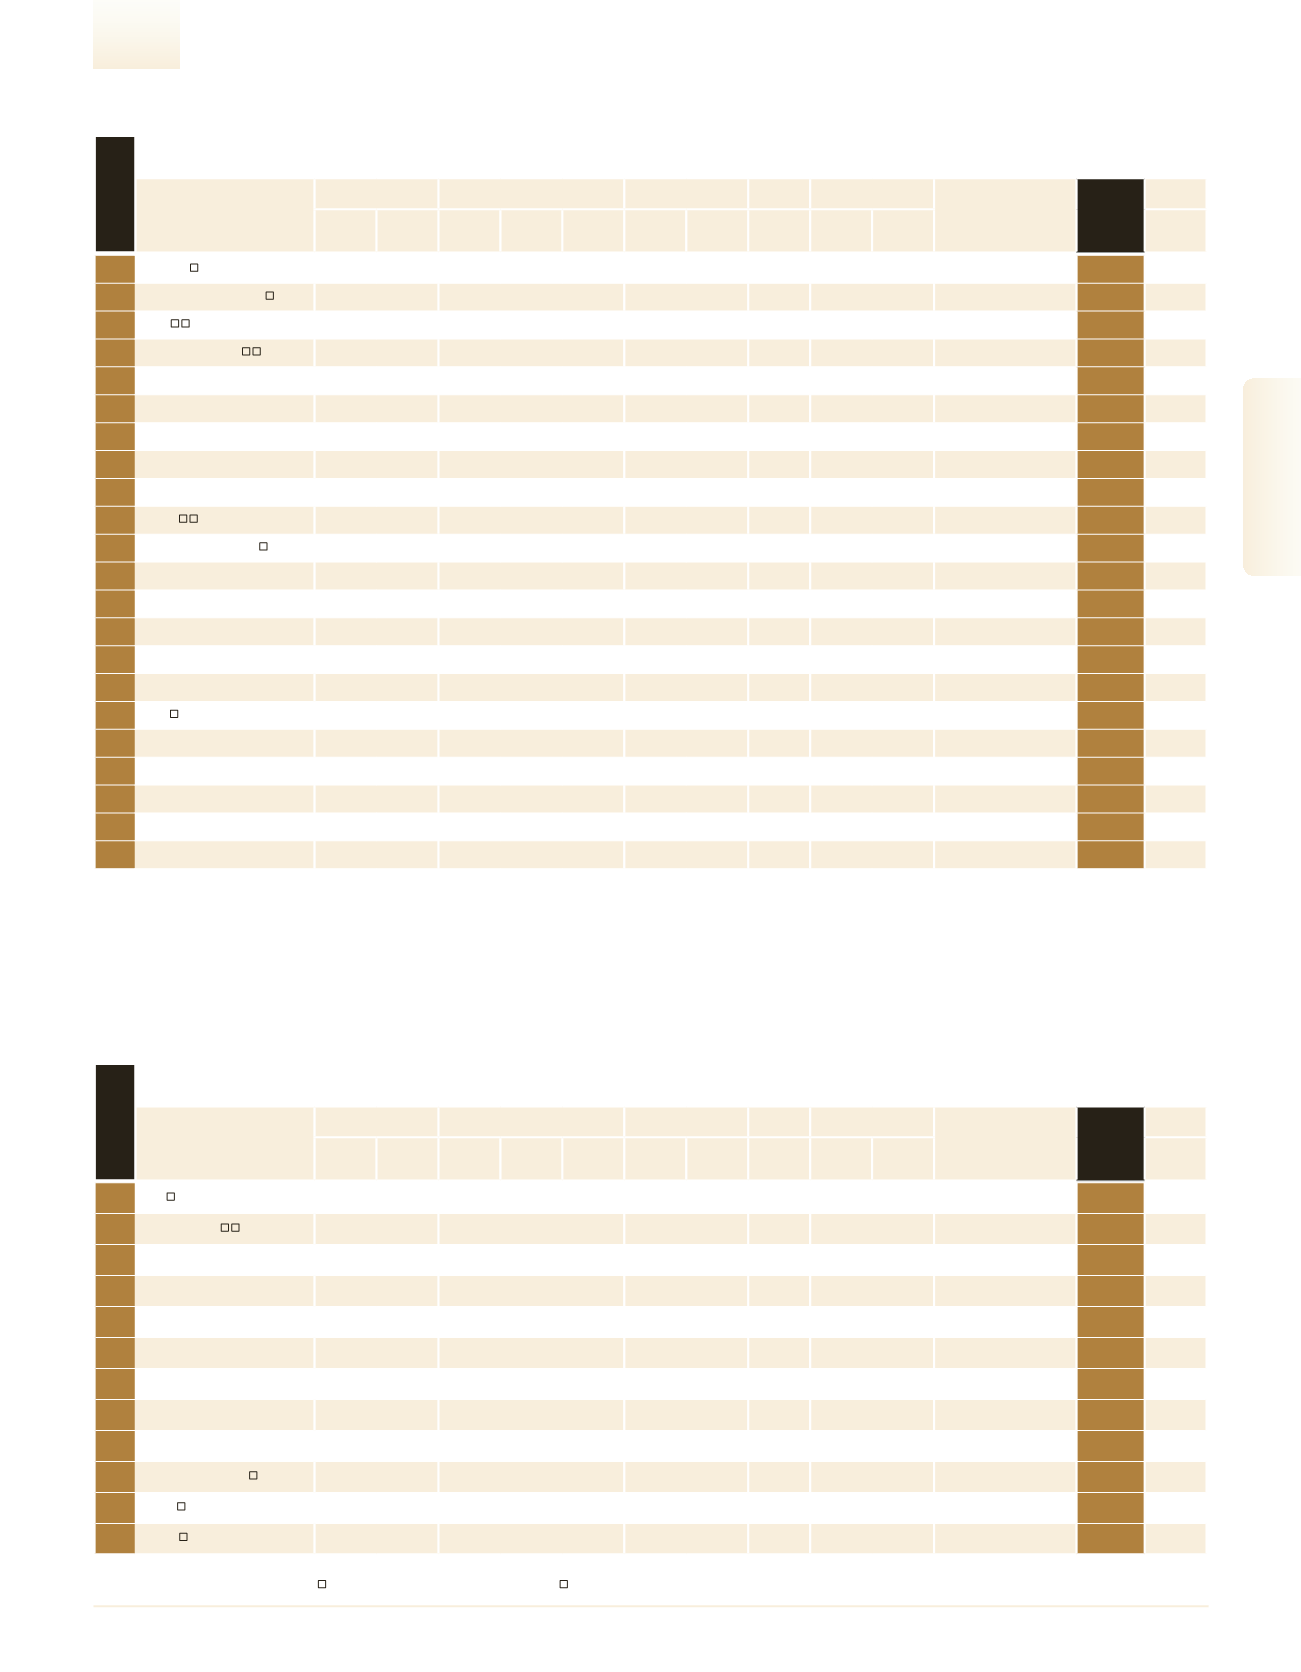
Software Development
1
Amdocs
14,162.1
11.1
– – –
1,734.2 12.2 13,293.5 24,950
567.6
–
7
40
2
Check Point Software
6,335.0
18.4
– – –
2,665.9 42.1 13,781.3 3,898 1,625.2
–
14
3
NICE
3,602.6
15.5
3,586.2
15.6
99.5
546.4 15.2
5,521.9 3,316 1,086.4
–
23
4
Formula Systems
2,917.3
28.1
866.5 130.2
29.7
286.5
9.8
1,762.0 10,981
265.7
–
28
5
NCR Global
1,440.0
–
– – –
– –
–
1,850
778.4
NCR CORPORATION
57
6
Microsoft Israel R&D
942.0
71.3
– – –
– –
–
970
971.1
Capital Limited Microsoft
Ireland
78
7
Mercury Interactive
929.0
–
– – –
– –
–
1,300
714.6
Hewlett Packard
Enterprise
82
8
Fundtech
890.0
–
– – –
– –
–
1,600
556.3
–
88
9
Sapiens Technologies
720.3
27.9
– – –
– –
–
1,573
457.9
Sapiens International
Corporation B.V
108
10
Magic
684.2
16.4
542.7
12.2
79.3
63.0
9.2
745.3 1,203
568.8
Formula Systems (1985)
*
11
Cyber-Ark Software
625.1
69.6
604.8
71.2
96.8
– –
962.5
–
– –
117
12
Sap Labs Israel
509.0
99.6
– – –
– –
–
650
783.1
SAP AG
132
13
BMC Software Israel
500.0
–
– – –
– –
–
349 1,432.7
BMC Software Inc.
134
14
ClickSoftware
480.0
–
– – –
– –
–
780
615.4
–
139
15
Aman Computers Group
420.0
5.0
– – –
– –
–
1,100
381.8
–
151
16
Ex Libris
414.4
11.2
404.5
11.4
97.6
– –
980.7
650
637.5
ProQuest LLC
152
17
Vizrt
405.2
-20.0
– – –
37.8
9.3
466.9
596
679.8
–
155
18
Cellltick Technologies
395.8
0.6
395.8
0.6 100.0
– –
197.6
126 3,141.3
Cellltick Technologies Inc
157
19
rendom logic
385.0
–
– – –
– –
–
750
513.3
–
163
20
SafeNet Data Security (Israel)
360.0
–
– – –
– –
–
155 2,322.6
–
174
21
Kenshoo
290.0
–
– – –
– –
–
570
508.8
–
200
22
Sysnet - Software
225.0
16.0
– – –
– –
39.0
600
375.0
Amanet Management &
Systems
229
Company
Sales
Exports/Overseas Sales
Net Profit
Equity
Employees
Parent Company
MAIN
RANK
2016
Industry
Profile
NIS
Millions
Change
(%)
NIS
Millions
Change
(%)
% of Total
Sales
NIS
Millions
Profitability
(%)
NIS
Millions
No.
Sales per
Employee
NIS (000)
See
Page
rank 2016
Ranking Tables
Defense Industry
1
I.A.I
14,412.6
5.3 11,295.3
5.8
78.4
31.1
0.2
3,882.5 15,734
916.0
State of Israel
6
41
2
Elbit Systems
12,078.9
14.1
9,682.2
16.7
80.2
787.1
6.5
5,440.7 12,134
995.5
–
8
3
Rafael
7,845.0
11.7
4,840.4
26.3
61.7
459.0
5.9
3,188.7 7,245 1,082.8
State of Israel
11
42
4
Elta
4,290.1
7.7
3,580.1
8.2
83.5
– –
1,676.2 3,400 1,261.8
Israel Aerospace Ind.
*
43
5
Taas-IMI
1,927.0
13.1
759.5
16.2
39.4
– –
–
3,184
605.2
State of Israel
40
6
Plasan Sasa
1,008.0
–
– – –
– –
–
1,350
746.7
Sasa Farmers A.C.S
75
7
SK Group
704.0
17.7
680.0
25.9
96.6
– –
–
860
818.6
–
112
8
Aeronautics
470.7
-14.4
– – –
– –
–
530
888.2
–
143
9
SCD
369.3
27.9
189.3
35.1
51.3
– –
438.4
420
879.3
Elbit Systems + Rafael
*
10
P.C.B Technologies
304.0
-16.2
70.3 -15.4
23.1
-3.6 -1.2
221.3
647
469.8
Priortech
*
11
F.M.S.
283.5
15.9
265.1
16.7
93.5
74.8 26.4
172.9
130 2,180.9
–
204
12
Magal
247.7
-10.7
199.5
-8.6
80.5
12.2
4.9
217.7
328
755.3
–
221
Company
Sales
Exports/Overseas Sales
Net Profit
Equity
Employees
Parent Company
MAIN
RANK
2016
Industry
Profile
NIS
Millions
Change
(%)
NIS
Millions
Change
(%)
% of Total
Sales
NIS
Millions
Profitability
(%)
NIS
Millions
No.
Sales per
Employee
NIS (000)
See
Page
rank 2016
2016/17
|
High-Tech & Technology -
DUN’S
100
31