


 32 / 74

A subsidiary of a ranked company |
Company shares are traded in Israel |
Company shares are traded abroad |
Estimated figures
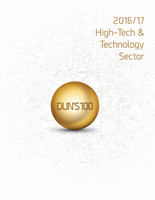
Ranking Tables
Electronic Systems
1
Indigo
4,200.0
–
– – –
– –
–
2,200 1,909.1
HP Inc
18
2
Orbotech
2,925.0
40.3
2,925.0
40.3 100.0
220.7
7.5
2,218.3 2,295 1,274.5
–
27
3
Stratasys
2,705.3
0.8
– – –
-5,338.7 -197.3
4,638.7 2,721
994.2
–
29
4
Flex
2,294.8
-10.3
88.6 -38.5
3.9
– –
746.3 3,140
730.8
Flextronics Central B.V
33
5
Applied Materials Israel
1,900.0
10.5
– – –
– –
–
1,054 1,802.7
Applied Materials Inc.
42
6
HP Industrial Printing
980.0
–
– – –
– –
–
580 1,689.7
HP Inc.
77
7
Mobileye
936.2
82.2
220.3
68.0
23.5
266.1 28.4
2,011.4
542 1,727.4
Mobileye N.V
79
8
KLA-Tencor (Israel)
820.0
–
– – –
– –
–
400 2,050.0
KLA-Tencor Corp.
96
9
Priortech
689.3
1.7
434.9
9.7
63.1
-43.1 -6.3
399.2 1,898
363.2
–
113
10
Nova
577.3
33.8
577.3
33.8 100.0
61.1 10.6
628.5
496 1,163.8
–
120
45
11
Maytronics
471.5
15.3
– – –
59.0 12.5
248.1
259 1,820.5
Kibbutz Yizreel
143
12
R.H. Technologies
469.0
0.8
70.5
28.2
15.0
-4.1 -0.9
109.4
850
551.8
–
144
13
Camtek
385.9
22.1
– – –
-39.3 -10.2
266.1
498
774.8
Priortech
*
14
Risco Group
379.8
-6.1
365.4
-7.4
96.2
– –
132.9
605
627.8
–
165
15
O.R Technologies
360.3
22.1
311.3
20.3
86.4
19.4
5.4
81.7
473
761.7
Inter Gama Investments
173
16
U.S.R Electronic Systems
(1987)
350.0
–
– – –
– –
–
550
636.4
–
177
17
S.C.R Engineers
325.0
–
– – –
– –
–
320 1,015.6
–
188
18
Crow Technologies
243.7
0.6
236.5
0.1
97.0
– –
68.7
500
487.4
–
222
19
A.V.T
200.1
3.4
198.1
2.8
99.0
10.8
5.4
118.0
229
873.9
–
240
20
EIM Group
190.9
11.7
– – –
– –
–
135 1,413.7
EIM International
Electronics
248
21
Sarine Technologies
188.3
-40.0
174.8 -40.9
92.8
13.9
7.4
279.1
–
– –
250
22
A.L. Electronics
180.0
5.9
111.0 109.4
61.7
– –
–
260
692.3
–
254
46
23
VeriFone Israel
155.4
-7.5
44.7 -29.6
28.8
15.3
9.8
186.7
252
616.7
VeriFone Inc.
271
24
Orad Hi-Tec Systems
114.1
-21.3
111.6
-8.3
97.8
– –
38.2
220
518.7
Avid Technology
290
Company
Sales
Exports/Overseas Sales
Net Profit
Equity
Employees
Parent Company
MAIN
RANK
2016
Industry
Profile
NIS
Millions
Change
(%)
NIS
Millions
Change
(%)
% of Total
Sales
NIS
Millions
Profitability
(%)
NIS
Millions
No.
Sales per
Employee
NIS (000)
See
Page
rank 2016
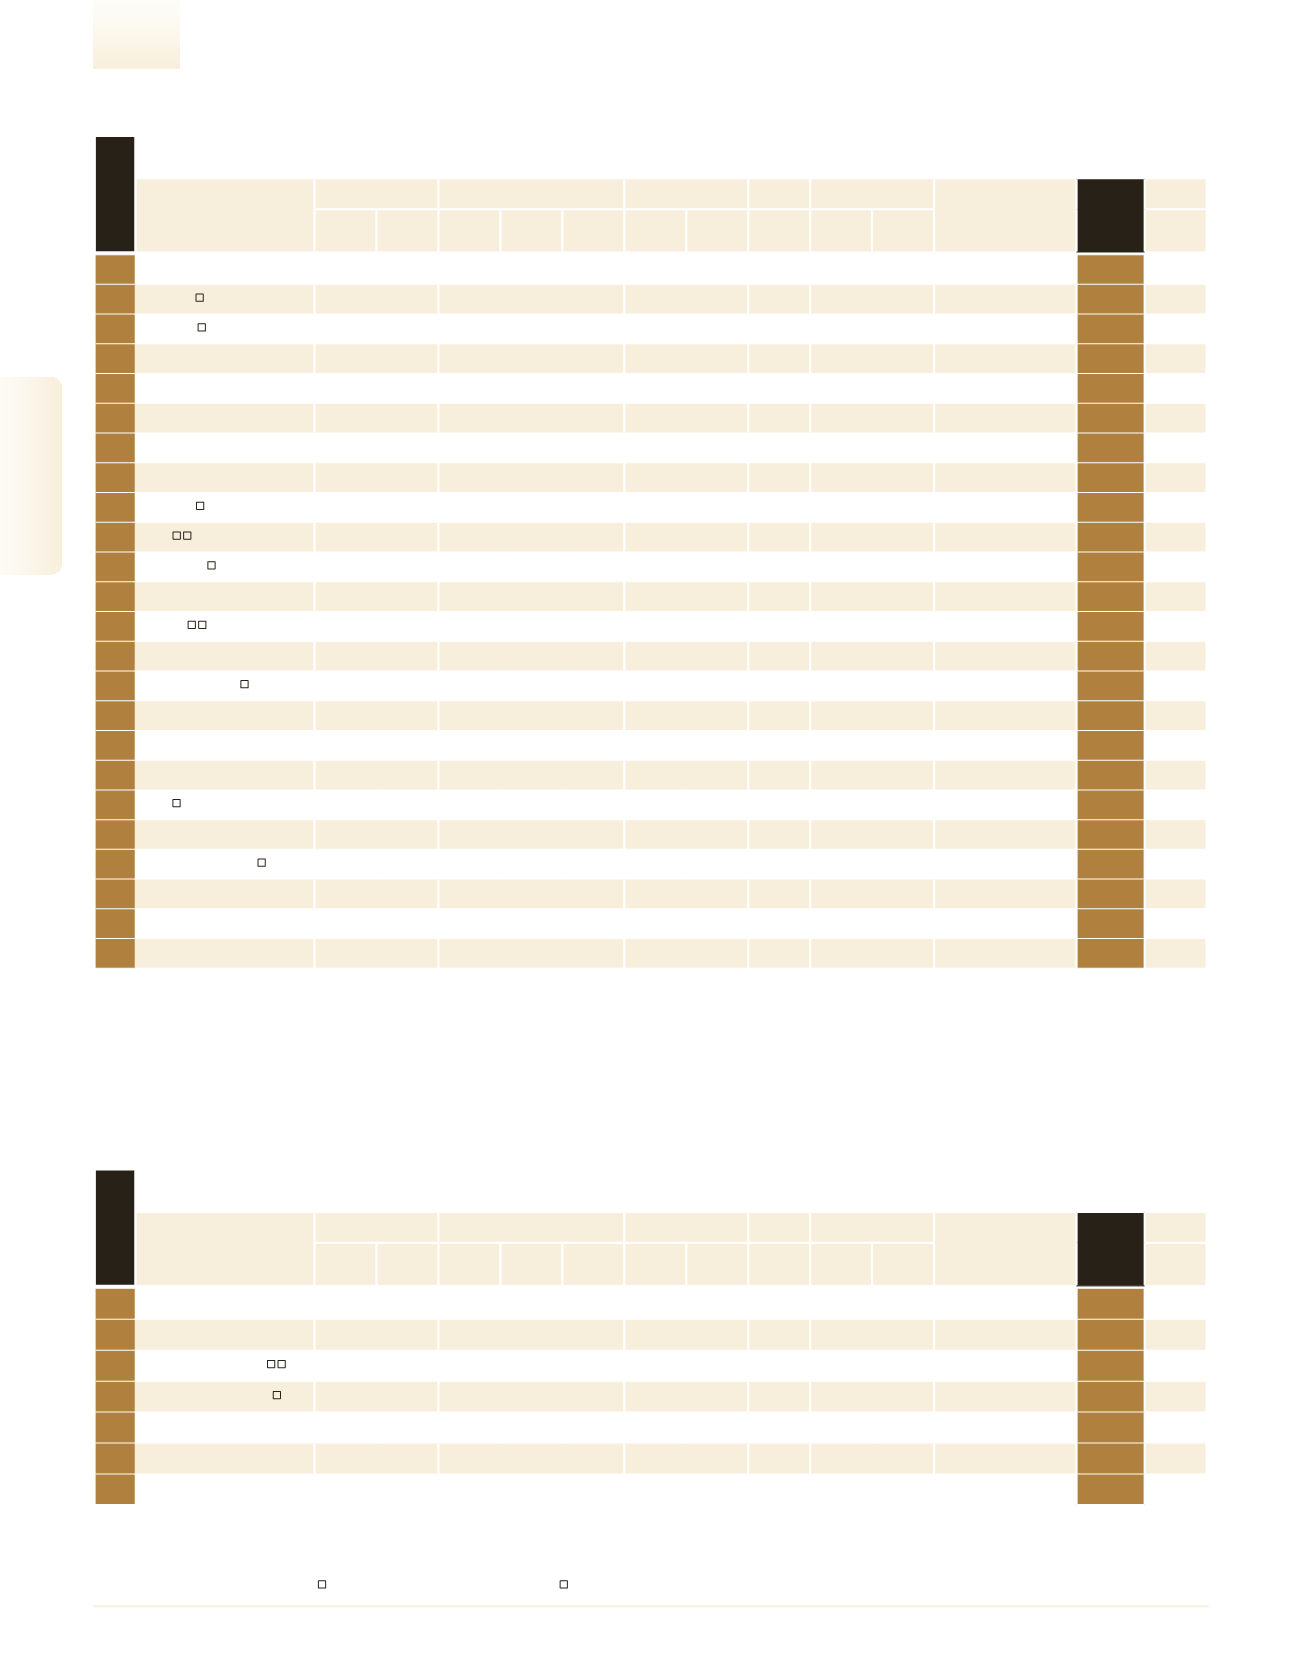
Chips & Semiconductors
1
Intel
1
15,916.9
4.8 15,916.9
4.8 100.0
– –
–
10,000 1,591.7
Intel Corporation
5
2
Vishay Israel
6,538.4
-0.7
6,488.7
-0.8
99.2
– –
–
12,099
540.4
Vishay Intertechnology Inc.
13
3
Tower Semiconductor
3,733.6
26.0
– – –
-113.2 -3.0
1,550.4
–
– –
22
4
Mellanox Technologies
2,558.1
54.2
2,530.9
53.9
98.9
361.1 14.1
3,381.1 1,922 1,331.0
–
30
44
5
Marvell Israel (M.I.S.L)
858.9
-21.4
858.9 -21.4 100.0
– –
985.2
635 1,352.6
Marvel International
90
6
DSP Group
560.9
10.7
– – –
– –
–
200 2,804.4
DSP group Inc.
123
7
SanDisk IL
382.9
-8.5
– – –
– –
–
562
681.2
SanDisk Corporation
164
1
- The Data refurs to Intel Electronics, Intel Israel (74) & Intel Mobile Communication Israel.
Company
Sales
Exports/Overseas Sales
Net Profit
Equity
Employees
Parent Company
MAIN
RANK
2016
Industry
Profile
NIS
Millions
Change
(%)
NIS
Millions
Change
(%)
% of Total
Sales
NIS
Millions
Profitability
(%)
NIS
Millions
No.
Sales per
Employee
NIS (000)
See
Page
rank 2016
High-Tech & Technology -
DUN’S
100
|
2016/17
32
Ranking Tables