


 33 / 74

A subsidiary of a ranked company |
Company shares are traded in Israel |
Company shares are traded abroad |
Estimated figures
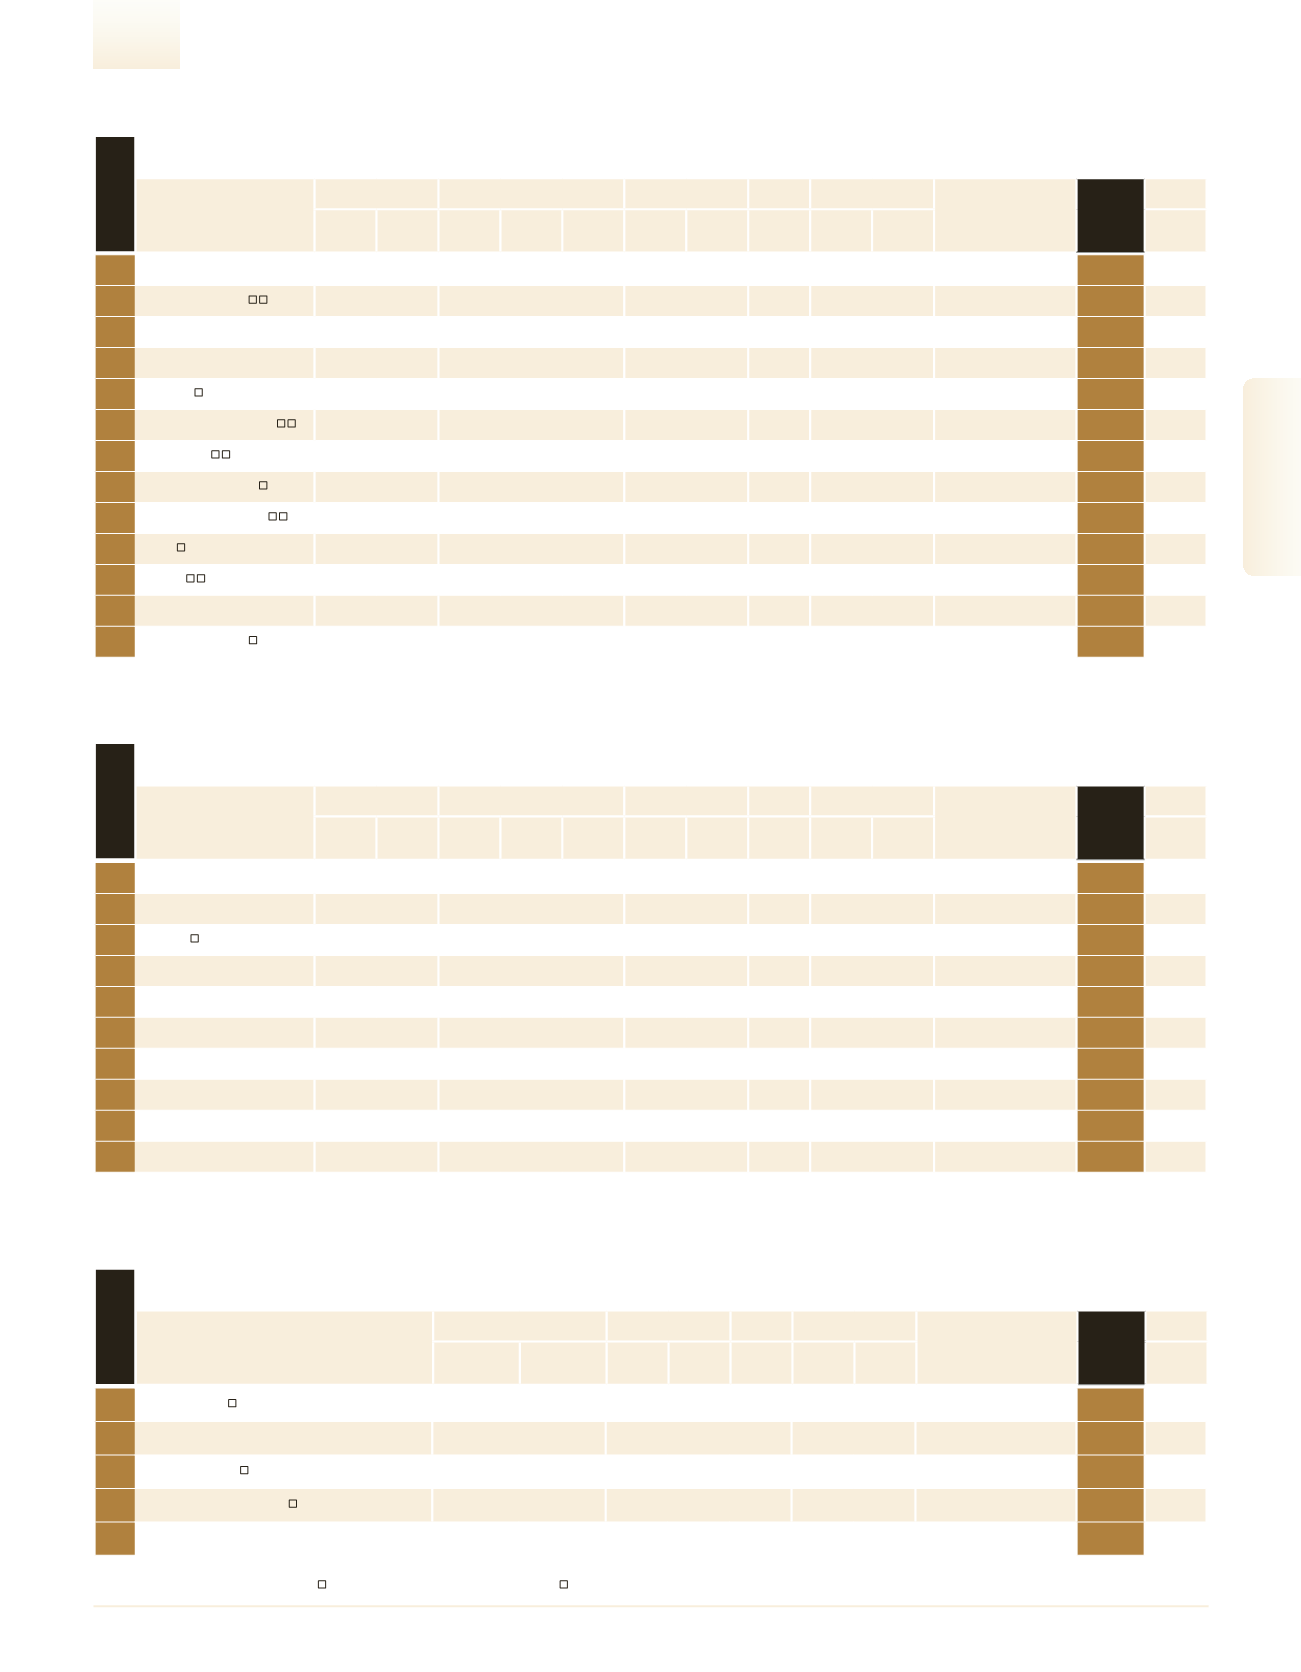
Communication Systems and Equipment
1
Motorola Solutions Israel
1,650.0
–
– – –
– –
–
1,000 1,650.0
Motorola Solutions Inc.
50
2
Ceragon Networks
1,358.2
2.3
1,358.2
2.3 100.0
3.9
0.3
401.2
871 1,559.4
–
58
3
ECI Telecom
1,300.0
–
1,150.0
–
88.5
– –
450.0 1,700
764.7
Epsilon 1
62
4
Xura - Formarly Comverse
1,053.0
-38.3
– – –
– –
–
1,500
702.0
Xura Inc.
72
5
Radware
841.8
6.0
– – –
72.2
8.6
1,245.2
996
845.2
–
92
6
Gilat Satellite Networks
767.8
-8.7
767.9
-8.7 100.0
-203.4 -26.5
694.9 1,037
740.4
–
104
7
AudioCodes
543.2
0.2
518.3
0.9
95.4
1.4
0.3
458.3
641
847.5
–
126
8
MagicJack VocalTec
392.4
-5.7
– – –
52.5 13.4
186.0
92 4,265.5
–
159
9
Allot Communications
388.6
-7.3
– – –
-77.1 -19.8
637.6
517
751.6
–
162
10
BATM
377.4
-3.5
272.1
-4.3
72.1
-51.5 -13.6
319.8
–
– –
167
11
Silicom
321.6
18.9
321.6
18.9 100.0
64.2 20.0
440.3
238 1,351.2
–
190
12
Teldor Cables & Systems
265.0
–
– – –
– –
–
340
779.4
–
212
13
Orbit Technologies
175.4
-4.5
128.3 -15.7
73.1
4.9
2.8
74.0
203
863.8
–
256
Company
Sales
Exports/Overseas Sales
Net Profit
Equity
Employees
Parent Company
MAIN
RANK
2016
Industry
Profile
NIS
Millions
Change
(%)
NIS
Millions
Change
(%)
% of Total
Sales
NIS
Millions
Profitability
(%)
NIS
Millions
No.
Sales per
Employee
NIS (000)
See
Page
rank 2016
Medical Equipment
1
GE Healthcare
1,250.0
-10.7
1,210.0 -10.9
96.8
– –
336.6
409 3,056.2
Versamed Medical Systems
66
2
Lumenis
1,100.0
–
– – –
– –
–
1,200
916.7
–
68
3
Syneron
1,080.0
18.0
1,062.6
17.6
98.4
-24.6 -2.3
816.3
784 1,377.5
–
69
4
Philips Medical Systems
926.3
12.6
852.2
15.1
92.0
– –
–
850 1,089.8
Philips N.V Koninklijke
83
5
Given Imaging
715.0
–
– – –
– –
–
810
882.7
S.A.R.L GOVIDIEN GROUP
109
6
Sanmina SCI Israel Medical
Systems
582.7
9.1
– – –
– –
–
520 1,120.6
Sanmina-SCI Holdings
119
7
Degania Silicone
313.8
7.9
266.8
7.3
85.0
– –
127.3 1,700
184.6
–
192
8
Oridion Systems
280.0
–
– – –
– –
–
190 1,473.7
Covidien
206
9
Tuttnauer
252.6
7.0
225.4
6.8
89.2
– –
152.2
350
721.9
Tuttnauer Holdings
218
10
Carestream Health
173.4
0.2
173.4
0.2 100.0
– –
34.6
85 2,039.6
Carestream Health
Netherlands
258
Company
Sales
Exports/Overseas Sales
Net Profit
Equity
Employees
Parent Company
MAIN
RANK
2016
Industry
Profile
NIS
Millions
Change
(%)
NIS
Millions
Change
(%)
% of Total
Sales
NIS
Millions
Profitability
(%)
NIS
Millions
No.
Sales per
Employee
NIS (000)
See
Page
rank 2016
Integration
1
Malam - Team
1,745.0
-0.9
50.1
2.9
360.1
2,888
604.2
–
15
47
2
Bynet Data Communication
1,200.0
9.1
– –
–
1,100 1,090.9
–
22
3
EMET Computing
869.1
15.5
50.9
5.9
230.6
659 1,318.9
–
35
4
Taldor Computer Systems
800.1
0.4
27.2
3.4
133.8
2,506
319.3
D.B.S.I. Investments
36
5
Arrow\Rapac
400.0
14.3
–
–
–
80 5,000.0
ARW Electronics
56
Company
Revenues
Net Profit
Equity
Employees
Parent Company
Main
Rank
2016
SERVICES
Profile
NIS
Millions
Change
(%)
NIS
Millions
Profitability
(%)
NIS
Millions
No.
Rev. per
Employee
NIS (000)
See
Page
rank 2016
Ranking Tables
2016/17
|
High-Tech & Technology -
DUN’S
100
33