


 34 / 74

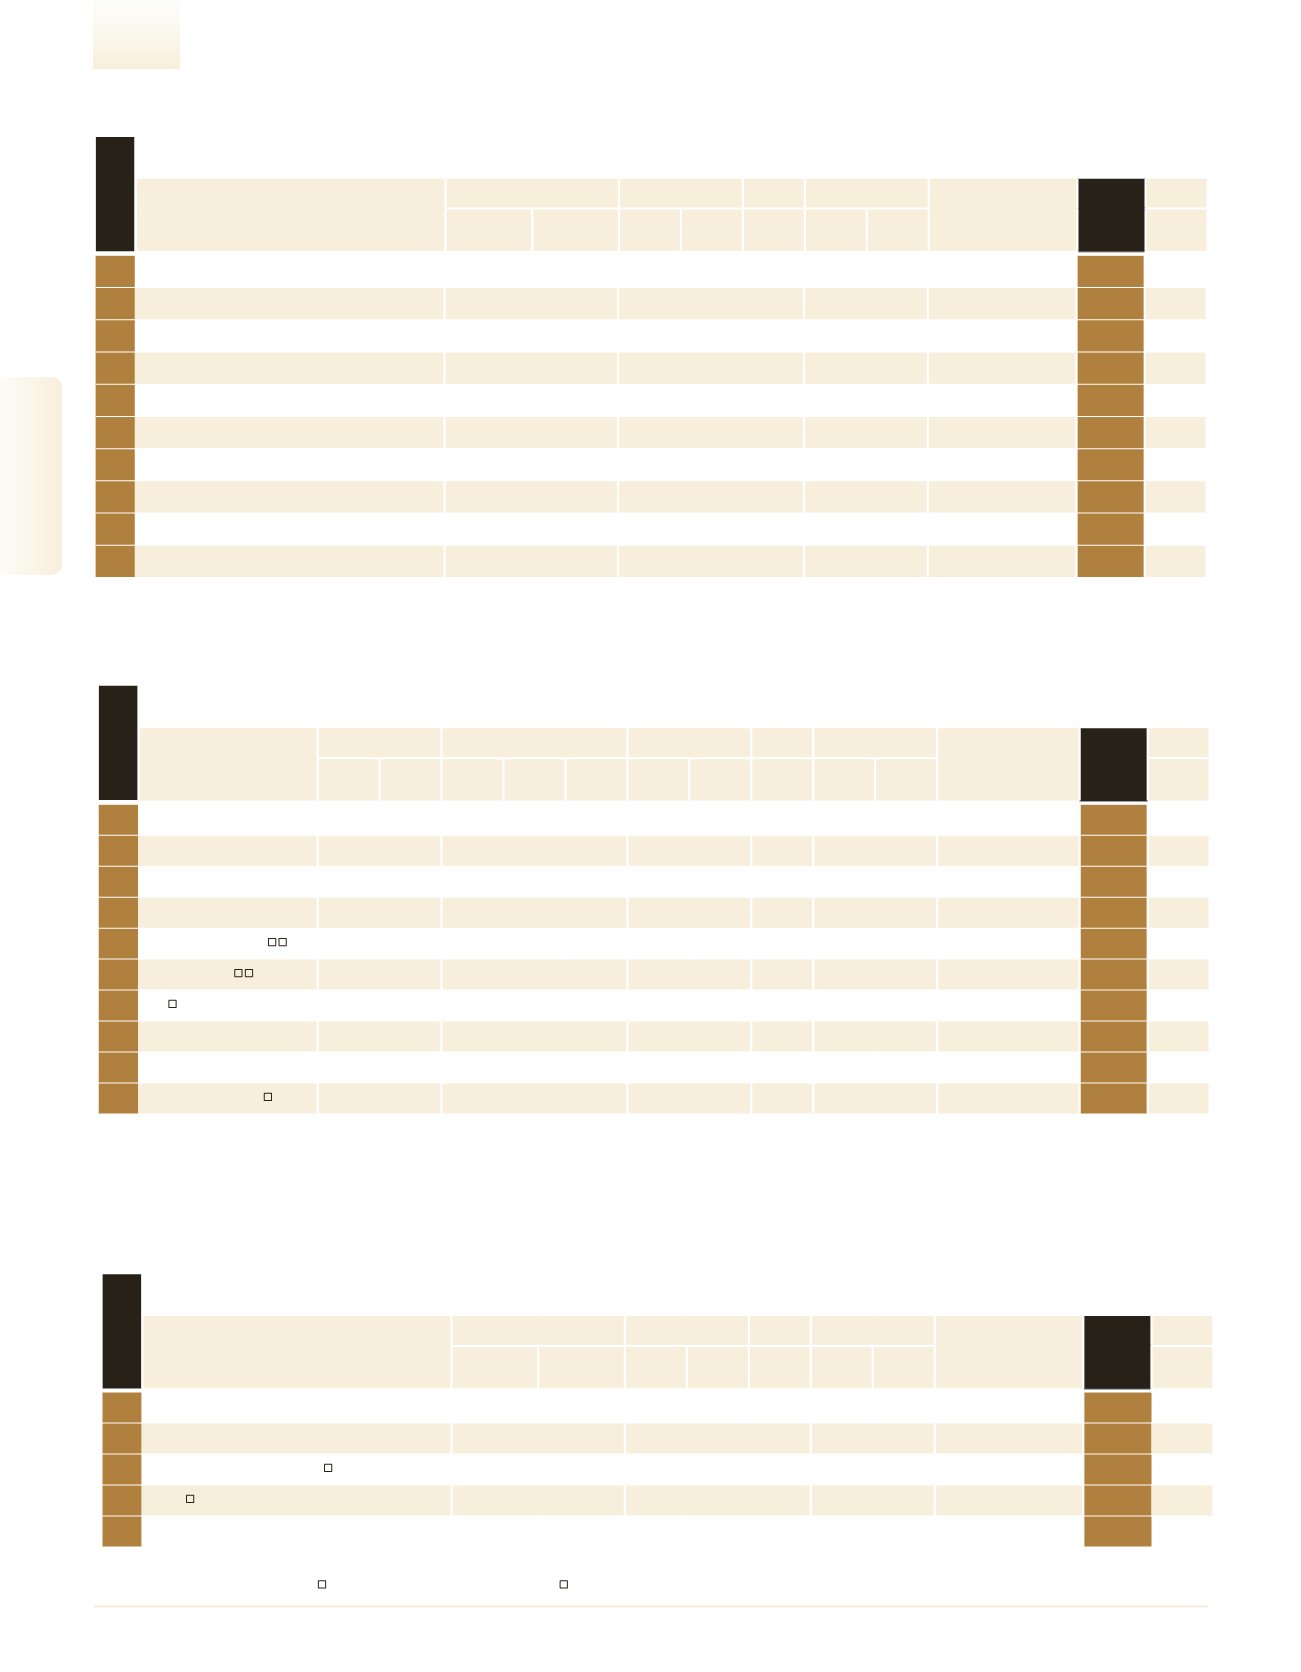
Internet
1
Playtika
1,902.0
50.1
– – –
– –
–
189 10,063.5
Caesars Interactive
Entertainment Israel
41
2
Outbrain
1,550.0
–
– – –
– –
–
550 2,818.2
Outbrain Inc.
53
3
Taboola
1,308.0
74.9
– – –
– –
–
380 3,442.1
–
61
4
Ironsource
1,300.0
18.2
– – –
– –
–
500 2,600.0
–
63
5
Matomy Media Group
1,053.3
24.0
1,052.1
24.0
99.9
25.7
2.4
422.2
–
– –
71
6
Perion Network
858.8
-38.3
858.8 -35.4 100.0
-266.9 -31.1
779.8
646 1,329.4
–
91
7
Wix
791.1
55.9
– – –
-199.5 -25.2
-14.8 1,067
741.4
–
100
8
Natural Intelligence
561.3
32.7
533.2
32.7
95.0
– –
– –
– –
122
9
Sizmek Technologies
341.0
-7.8
– – –
– –
–
272 1,253.6
Sizmek Technologies Inc.
181
10
Taptica International
294.7
30.5
274.5
32.8
93.1
8.4
2.8
176.7
–
– –
199
Company
Sales
Exports/Overseas Sales
Net Profit
Equity
Employees
Parent Company
MAIN
RANK
2016
Industry
Profile
NIS
Millions
Change
(%)
NIS
Millions
Change
(%)
% of Total
Sales
NIS
Millions
Profitability
(%)
NIS
Millions
No.
Sales per
Employee
NIS (000)
See
Page
rank 2016
Electronic Components Import
1
Eastronics
609.0
10.3
–
–
–
135 4,511.1
–
70
2
Avnet Components Israel
537.2
24.2
–
–
60.2
104 5,165.1
Avnet Inc
78
3
Nisko Electricity & Electronics
243.5
1.4
1.0
0.4
99.9
205 1,187.9
Nisko Holdings (1982)
136
4
Telsys
190.0
8.4
12.0
6.3
98.8
59 3,221.0
–
158
5
Future Electronics
144.3
3.8
–
–
21.0
32 4,510.8
Holding FI Future
174
Company
Revenues
Net Profit
Equity
Employees
Parent Company
Main
Rank
2016
Trade
Profile
NIS
Millions
Change
(%)
NIS
Millions
Profitability
(%)
NIS
Millions
No.
Rev. per
Employee
NIS (000)
See
Page
rank 2016
A subsidiary of a ranked company |
Company shares are traded in Israel |
Company shares are traded abroad |
Estimated figures
Import, Distribution and Marketing of Computer Equipment
1
C-Data
1,205.0
21.1
– –
127.0
81 14,876.5
Focus Trading
33
2
Team Netcom
1,150.0
–
– –
–
1,100 1,045.5
Malam - Team
36
3
HPE Israel
929.0
–
– –
–
1,200
774.1
Hewlett Packard
Enterprise
44
4
Getter Group
700.0
–
– –
–
500 1,400.0
–
62
5
Bug Multisystems
532.4
12.6
– –
–
684
778.3
Cultural and educational
Factories
79
6
CMS
480.0
6.7
– –
–
55 8,727.3
Mars Information Product
Group
87
7
Aztek
426.9
20.5
– –
–
22 19,404.5
–
96
8
Ivory
390.0
–
– –
–
230 1,695.7
–
103
9
Benda Magnetic
260.0
4.0
– –
–
130 2,000.0
Benda Investments
129
10
Amtel Computers
210.0
–
– –
–
43 4,883.7
Mango Investment
147
Company
Revenues
Net Profit
Equity
Employees
Parent Company
Main
Rank
2016
Trade
Profile
NIS
Millions
Change
(%)
NIS
Millions
Profitability
(%)
NIS
Millions
No.
Rev. per
Employee
NIS (000)
See
Page
rank 2016
Ranking Tables
High-Tech & Technology -
DUN’S
100
|
2016/17
34
Ranking Tables