


 83 / 730

Service & Trade
A
ccording to the Central Bureau of
Statistics, Gross Domestic Product
(GDP), in fixed prices, rose by 2.5%
in 2015 after rising 2.6% in 2014 and 3.3% in
2013 (GDP is equal to the net value of overall
goods and services produced in Israel). Exports
of goods and services, in fixed prices, fell 3.1%
in 2015, after rising 1.5% in 2014 and remain-
ing stable in 2013. Imports of goods and ser-
vices, in fixed prices, rose 0.6% in 2015, after
rising 3% in 2014 and rising 0.5% in 2013.
At the end of 2015, the Dun & Bradtsreet Index
for assessing the financial strength of the Is-
raeli economy, stood at 31.95 compared with
32.01 at the end of 2014. The fall in the Index
reflected a slowdown in private consumption
that mainly influenced the retail sector, and a
continued weakening in the industrial sector,
mainly due to a slowdown in world trade and
the low value of the Euro compared with the
shekel. At the midpoint of 2016, the Index
stood at 31.70, with the downward trend con-
tinuing following erosion in margins in most
branches of the economy and following a fall
in the value of Israeli exports.
Dun & Bradstreet data finds that in 2015 (simi-
lar to 2014), the field with the highest level of
risk was the cafés and restaurants sector, and
the field with the lowest level of risk was the
pharmaceuticals sector. The café and restau-
rant sector is characterized by a high risk level
and since 2013 has been coping with an ad-
ditional risk factor – price strategy. Until 2013,
the level of risk stemmed from surplus supply,
but price strategy began being expressed by
the establishment of the Cofix chain, and the
consequent lowering of sales prices among
some of the large chains.
In 2015, the average number of days of credit
rose by about 2.5% to 119 days (compared
with 116 in 2014). The average credit terms
under agreement was lengthened to 92 days
(compared with 84 in 2014) while the average
days in arrears actually shortened to 27 days
(compared with 32 in 2014).
As each year, Israel's leading service and
trade companies were ranked. At the top
of the trade company rankings was Paz, in
second place was Shufersal and in the third
place was Eurocom Communications. At the
top of the service company rankings was Zim,
in second place was Bezeq and in third place
was El Al.
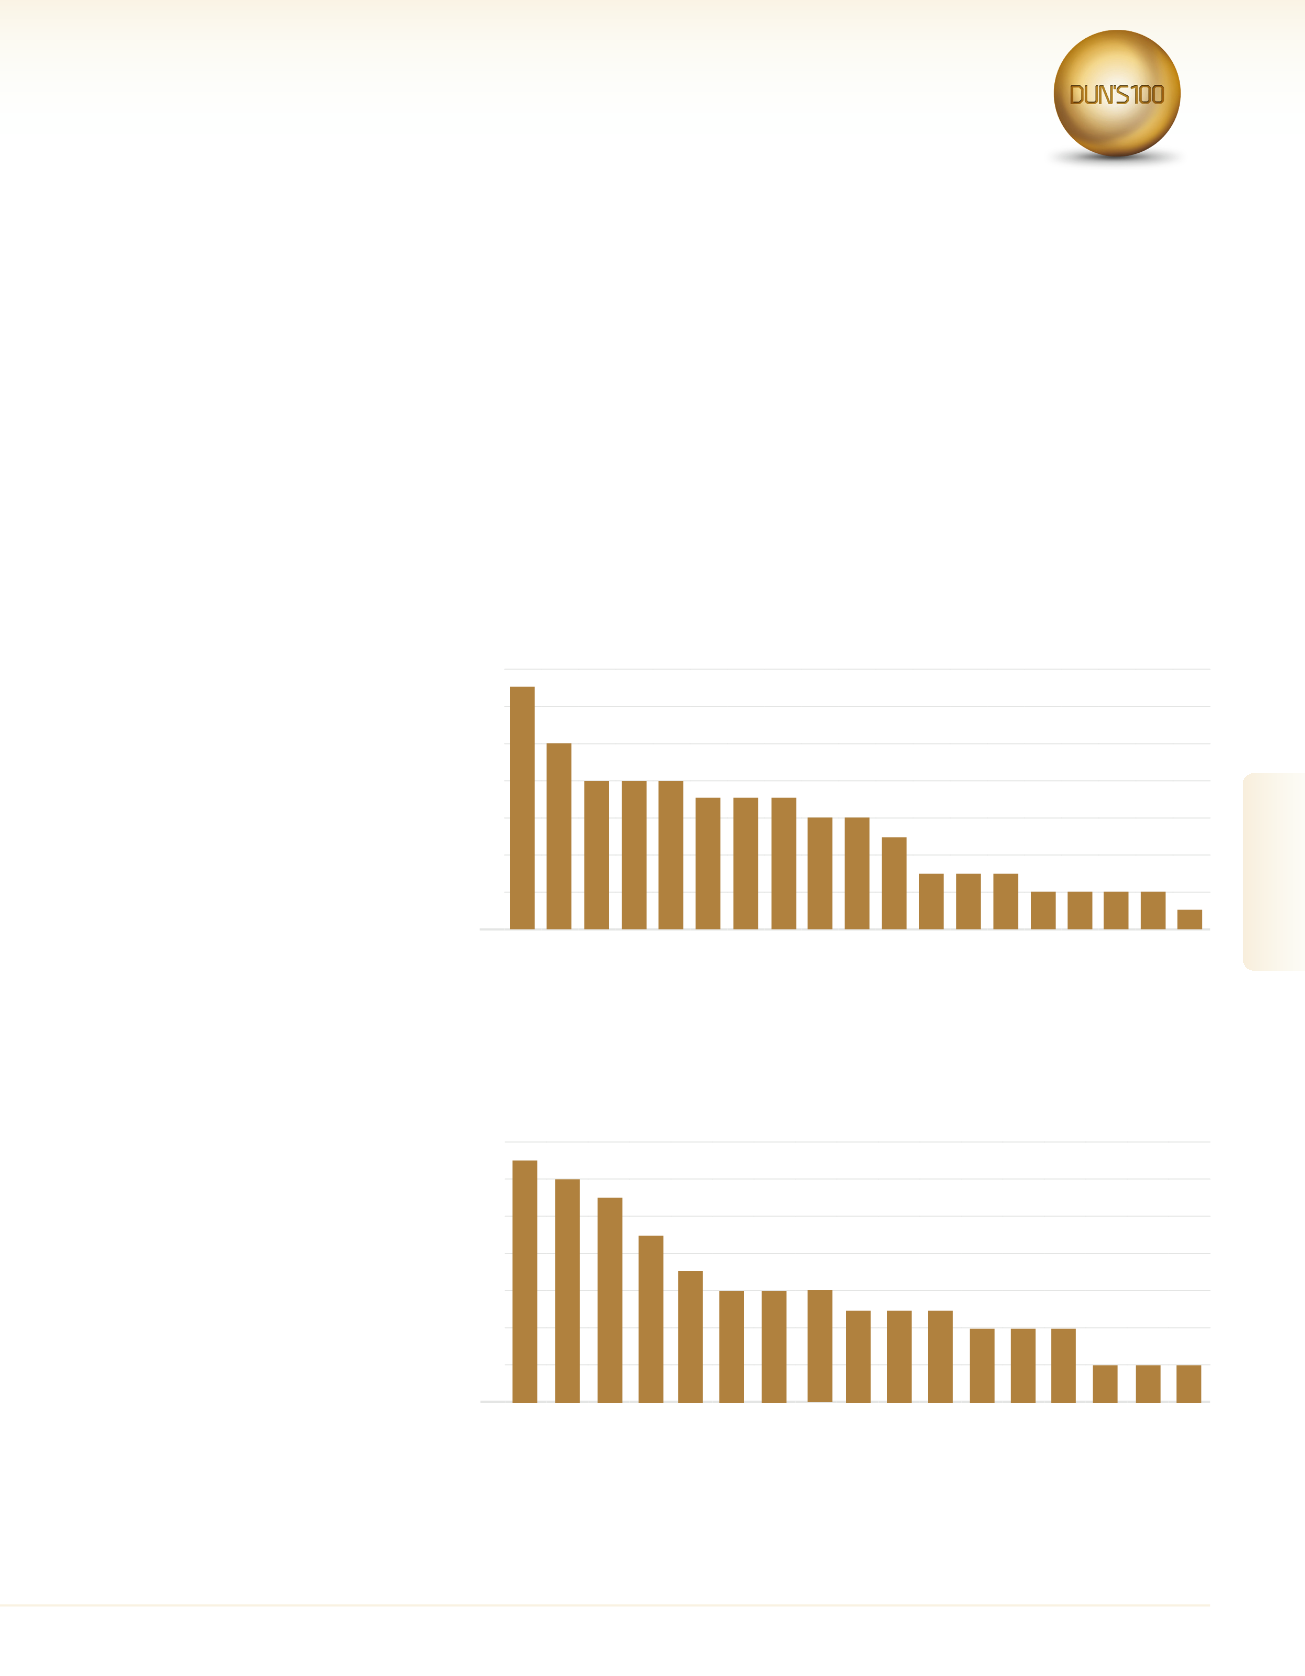
Among the sub-categories in the trade com-
pany rankings, the largest percentage of
companies was in the food and beverage re-
tail sub-category (13%) followed by 10% of
companies in the electrical products import
and marketing sub-category. Among the sub-
categories in the service company rankings,
the largest percentage of companies was in
the travel and tourism agencies sub-category
(13%), followed by 12% of companies in the
transport and shipping services sector, and
11% of companies ranked in the security,
guarding and cleaning sub-category.
14
13%
12
10%
10
8% 8% 8%
8
6% 6%
7% 7% 7%
6
5%
4
2% 2% 2% 2%
3% 3% 3%
2
1%
0
General trade
Retail Chains
Impt. / Dist. of Comm.
Equip.
Furniture & Home
Appliances
Natural Gas Companies
Cosmetics & Toiletries
Fast food chains and
restaurants
Electronic Components
Wholesale Distribution of
Med. Equip. & Medicines
Wholesale Consumer
Products
Petroleum & Infrastructure
Companies
Fashion & Footwear
Car Agency and Import
Import, Di and ma of
computer equipment
Construction Input, Metal,
Plumbing $ Wood
Food Retail
Import companies
Electronic Appliance Import
and Marketing Agencies
Wholesale Food
Distribution and Drinks
Trade Ranking 2016 by Sector
14
12%
13%
12
11%
10
9%
8
6% 6% 6%
7%
6
4% 4% 4%
5% 5% 5%
4
2% 2% 2%
2
0
Medical Services
Export Companies
Lotteries
Transportation
Infrastructure
Logistics Services
Communication Groups
General Services
Credit Cards
Integration
Waste Treatment,
Removal & Recycling
Media
Human Resources
Companies
Catering
Software Services
Security, Guarding and
Cleaning
Transportation Services
Travel & Tourism Agents
Service Ranking 2016 by Sector
83
2016
|
DUN’S
100
DUN’S
100
|
2016
DUN’S
100
|
2016
2016
|
DUN’S
100
Service & Trade