


 512 / 730

A subsidiary of a ranked company |
Company shares are traded in Israel |
Company shares are traded abroad |
Estimated figures
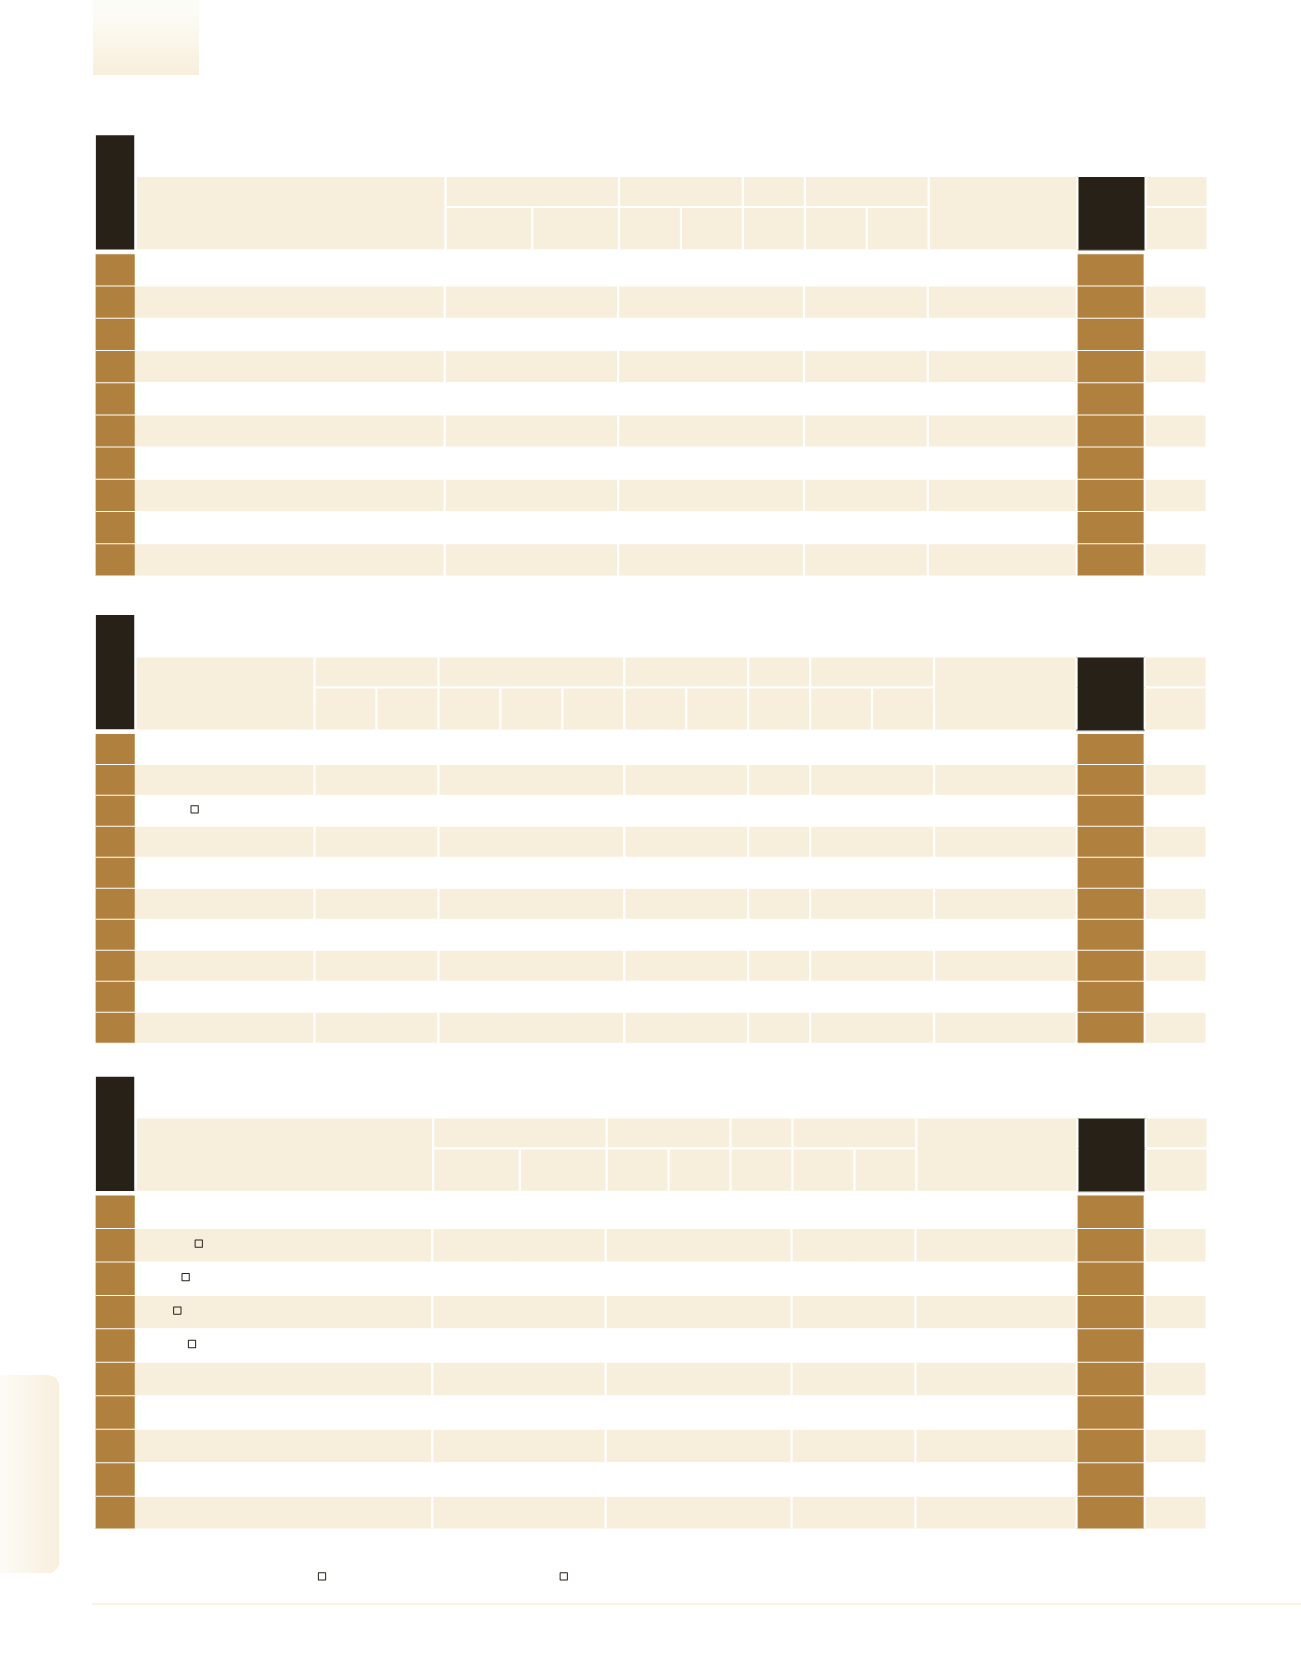
High-Tech, Electronics & Computing Ranking
512
2016
|
DUN’S
100
DUN’S
100
|
2016
DUN’S
100
|
2016
2016
|
DUN’S
100
High-Tech, Electronics &
Computing
Import, Distribution And Marketing Of Computer Equipment
1
C-Data
1,205.0
21.1
– –
127.0
81 14,876.5
Focus Trading
33
2
Team Netcom
1,150.0
–
– –
–
1,100 1,045.5
Malam - Team
36
3
HPE Israel
929.0
–
– –
–
1,200
774.1
Hewlett Packard
Enterprise
44
4
Getter Group
700.0
–
– –
–
500 1,400.0
–
62
5
Bug Multisystems
532.4
12.6
– –
–
684
778.3
Cultural and educational
Factories
79
6
CMS
480.0
6.7
– –
–
55 8,727.3
Mars Information Product
Group
87
7
Aztek
426.9
20.5
– –
–
22 19,404.5
–
96
8
Ivory
390.0
–
– –
–
230 1,695.7
–
103
9
Benda Magnetic
260.0
4.0
– –
–
130 2,000.0
Benda Investments
129
10
Amtel Computers
210.0
–
– –
–
43 4,883.7
Mango Investment
147
Company
Revenues
Net Profit
Equity
Employees
Parent Company
Main
Rank
2016
Trade
Profile
NIS
Millions
Change
(%)
NIS
Millions
Profitability
(%)
NIS
Millions
No.
Rev. per
Employee
NIS (000)
See
Page
rank 2016
Medical Equipment
1
GE Healthcare
1,250.0
-10.7
1,210.0 -10.9
96.8
– –
336.6
409 3,056.2
Versamed Medical Systems
66
2
Lumenis
1,100.0
–
– – –
– –
–
1,200
916.7
–
68
3
Syneron
1,080.0
18.0
1,062.6
17.6
98.4
-24.6 -2.3
816.3
784 1,377.5
–
69
4
Philips Medical Systems
926.3
12.6
852.2
15.1
92.0
– –
–
850 1,089.8
Philips N.V Koninklijke
83
5
Given Imaging
715.0
–
– – –
– –
–
810
882.7
S.A.R.L GOVIDIEN GROUP
109
6
Sanmina SCI Israel Medical
Systems
582.7
9.1
– – –
– –
–
520 1,120.6
Sanmina-SCI Holdings
119
7
Degania Silicone
313.8
7.9
266.8
7.3
85.0
– –
127.3 1,700
184.6
–
192
8
Oridion Systems
280.0
–
– – –
– –
–
190 1,473.7
Covidien
206
9
Tuttnauer
252.6
7.0
225.4
6.8
89.2
– –
152.2
350
721.9
Tuttnauer Holdings
218
10
Carestream Health
173.4
0.2
173.4
0.2 100.0
– –
34.6
85 2,039.6
Carestream Health
Netherlands
258
Company
Sales
Exports/Overseas Sales
Net Profit
Equity
Employees
Parent Company
MAIN
RANK
2016
Industry
Profile
NIS
Millions
Change
(%)
NIS
Millions
Change
(%)
% of Total
Sales
NIS
Millions
Profitability
(%)
NIS
Millions
No.
Sales per
Employee
NIS (000)
See
Page
rank 2016
Software Services
1
IBM Israel
2,750.0
–
– –
–
2,650 1,037.7
IBM Corp.
10
2
Matrix IT
2,280.2
8.5
99.8
4.4
623.8
7,644
298.3
Formula Systems (1985)
12
3
One-1
1,269.2
7.8
66.3
5.2
230.2
3,225
393.5
Computer Direct Group
19
4
Hilan
1,167.9
124.5
66.8
5.7
199.3
2,817
414.6
–
23
5
Amanet
320.7
9.5
10.9
3.4
94.4
1,369
234.3
–
69
6
SQLink
305.0
15.5
– –
30.0
1,150
265.2
–
72
7
Sap Israel
223.8
11.4
– –
10.9
69 3,243.4
SAP AG
78
8
Gav Systems
197.0
23.9
– –
–
900
218.9
–
86
9
Elad Software Systems
180.0
4.1
– –
14.0
750
240.0
–
87
10
LADPC
151.0
–
– –
–
503
300.2
One Software Services (1997)
90
Company
Revenues
Net Profit
Equity
Employees
Parent Company
Main
Rank
2016
SERVICES
Profile
NIS
Millions
Change
(%)
NIS
Millions
Profitability
(%)
NIS
Millions
No.
Rev. per
Employee
NIS (000)
See
Page
rank 2016