


 511 / 730

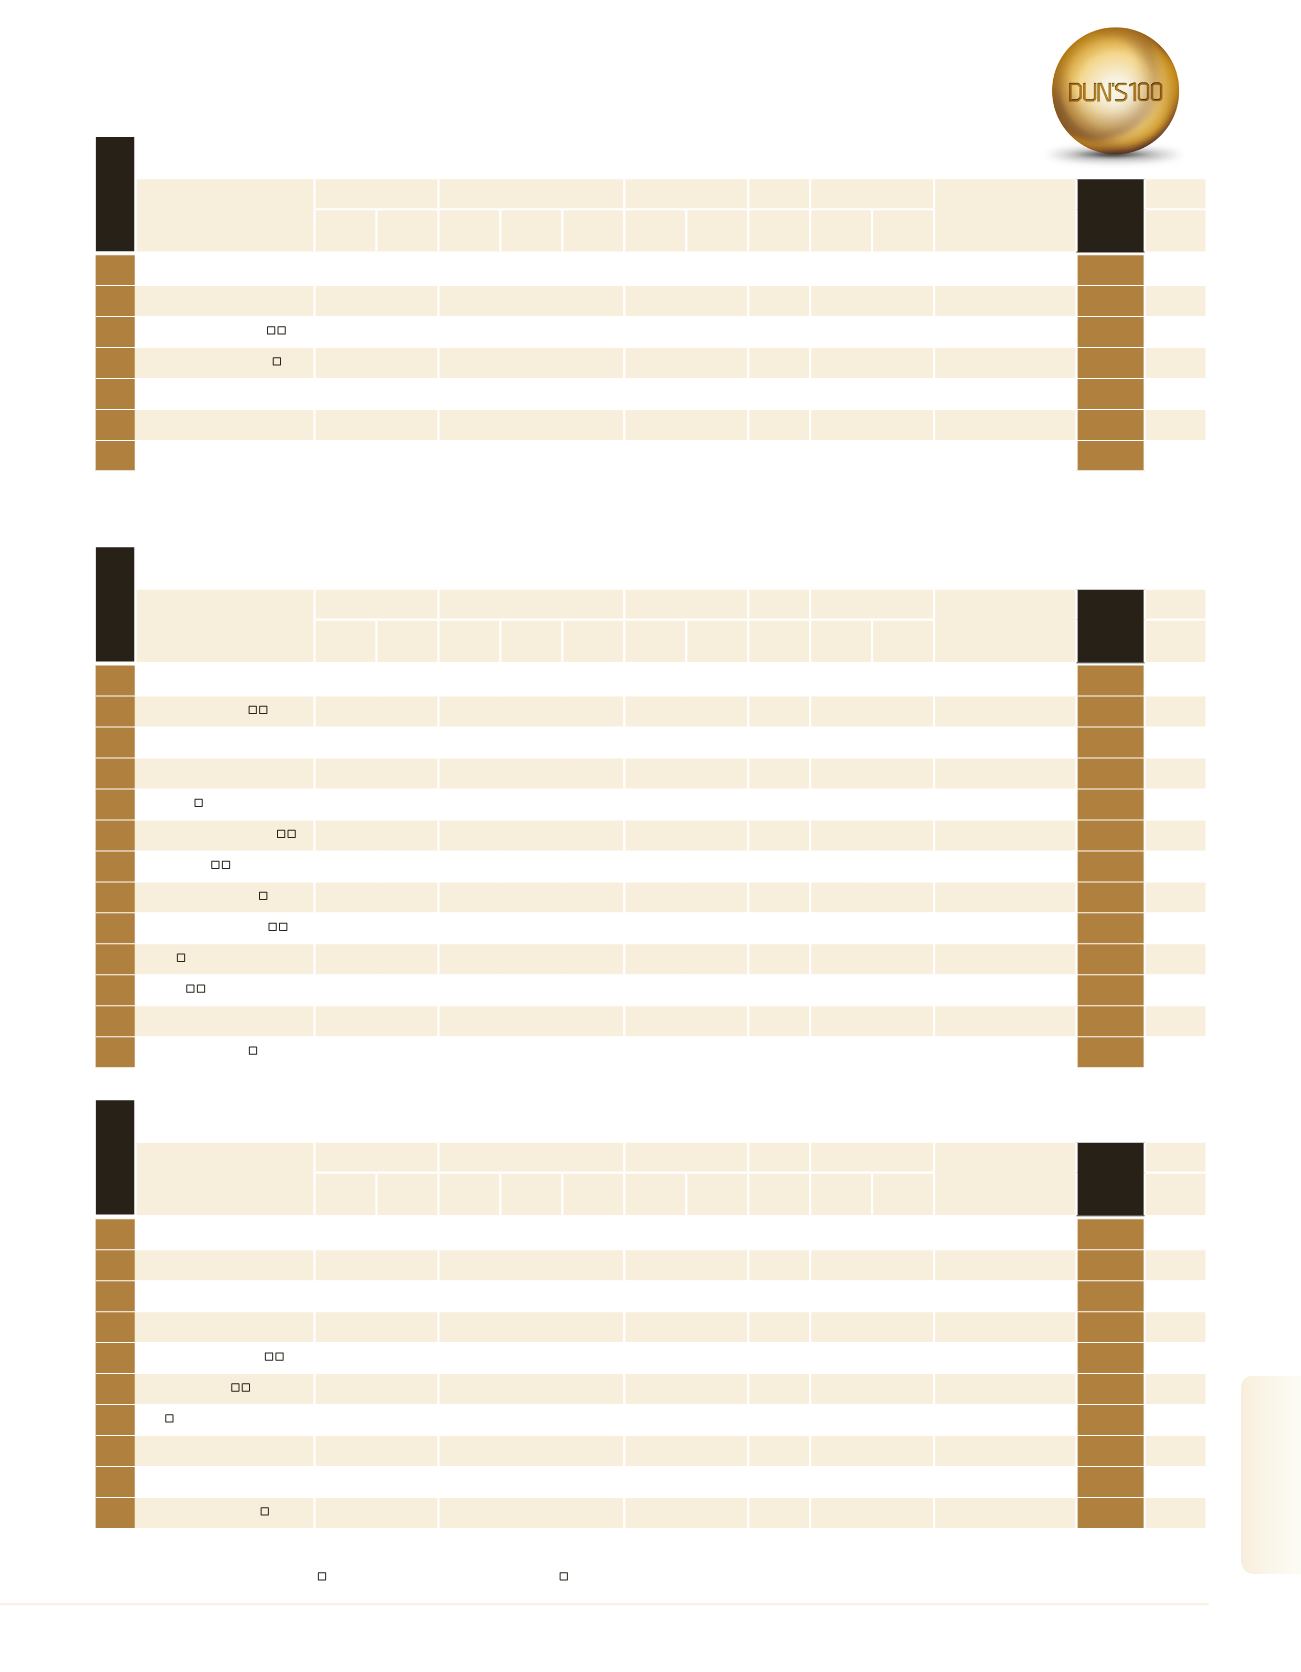
A subsidiary of a ranked company |
Company shares are traded in Israel |
Company shares are traded abroad |
Estimated figures
511
2016
|
DUN’S
100
DUN’S
100
|
2016
DUN’S
100
|
2016
2016
|
DUN’S
100
High-Tech, Electronics &
Computing
Chips & Semiconductors
1
Intel
1
15,916.9
4.8 15,916.9
4.8 100.0
– –
–
10,000 1,591.7
Intel Corporation
5
2
Vishay Israel
6,538.4
-0.7
6,488.7
-0.8
99.2
– –
–
12,099
540.4
Vishay Intertechnology Inc.
13
3
Tower Semiconductor
3,733.6
26.0
– – –
-113.2 -3.0
1,550.4
–
– –
22
4
Mellanox Technologies
2,558.1
54.2
2,530.9
53.9
98.9
361.1 14.1
3,381.1 1,922 1,331.0
–
30
5
Marvell Israel (M.I.S.L)
858.9
-21.4
858.9 -21.4 100.0
– –
985.2
635 1,352.6
Marvel International
90
6
DSP Group
560.9
10.7
– – –
– –
–
200 2,804.4
DSP group Inc.
123
7
SanDisk IL
382.9
-8.5
– – –
– –
–
562
681.2
SanDisk Corporation
164
1
- The Data refurs to Intel Electronics, Intel Israel (74) & Intel Mobile Communication Israel.
Communication Systems and Equipment
1
Motorola Solutions Israel
1,650.0
–
– – –
– –
–
1,000 1,650.0
Motorola Solutions Inc.
50
519
2
Ceragon Networks
1,358.2
2.3
1,358.2
2.3 100.0
3.9
0.3
401.2
871 1,559.4
–
58
3
ECI Telecom
1,300.0
–
1,150.0
–
88.5
– –
450.0 1,700
764.7
Epsilon 1
62
4
Xura - Formarly Comverse
1,053.0
-38.3
– – –
– –
–
1,500
702.0
Xura Inc.
72
5
Radware
841.8
6.0
– – –
72.2
8.6
1,245.2
996
845.2
–
92
6
Gilat Satellite Networks
767.8
-8.7
767.9
-8.7 100.0
-203.4 -26.5
694.9 1,037
740.4
–
104
7
AudioCodes
543.2
0.2
518.3
0.9
95.4
1.4
0.3
458.3
641
847.5
–
126
8
MagicJack VocalTec
392.4
-5.7
– – –
52.5 13.4
186.0
92 4,265.5
–
159
9
Allot Communications
388.6
-7.3
– – –
-77.1 -19.8
637.6
517
751.6
–
162
10
BATM
377.4
-3.5
272.1
-4.3
72.1
-51.5 -13.6
319.8
–
– –
167
11
Silicom
321.6
18.9
321.6
18.9 100.0
64.2 20.0
440.3
238 1,351.2
–
190
12
Teldor Cables & Systems
265.0
–
– – –
– –
–
340
779.4
–
212
13
Orbit Technologies
175.4
-4.5
128.3 -15.7
73.1
4.9
2.8
74.0
203
863.8
–
256
Company
Sales
Exports/Overseas Sales
Net Profit
Equity
Employees
Parent Company
MAIN
RANK
2016
Industry
Profile
NIS
Millions
Change
(%)
NIS
Millions
Change
(%)
% of Total
Sales
NIS
Millions
Profitability
(%)
NIS
Millions
No.
Sales per
Employee
NIS (000)
See
Page
Company
Sales
Exports/Overseas Sales
Net Profit
Equity
Employees
Parent Company
MAIN
RANK
2016
Industry
Profile
NIS
Millions
Change
(%)
NIS
Millions
Change
(%)
% of Total
Sales
NIS
Millions
Profitability
(%)
NIS
Millions
No.
Sales per
Employee
NIS (000)
See
Page
rank 2016
rank 2016
Internet
1
Playtika
1,902.0
50.1
– – –
– –
–
189 10,063.5
Caesars Interactive
Entertainment Israel
41
2
Outbrain
1,550.0
–
– – –
– –
–
550 2,818.2
Outbrain Inc.
53
3
Taboola
1,308.0
74.9
– – –
– –
–
380 3,442.1
–
61
4
Ironsource
1,300.0
18.2
– – –
– –
–
500 2,600.0
–
63
5
Matomy Media Group
1,053.3
24.0
1,052.1
24.0
99.9
25.7
2.4
422.2
–
– –
71
6
Perion Network
858.8
-38.3
858.8 -35.4 100.0
-266.9 -31.1
779.8
646 1,329.4
–
91
523
7
Wix
791.1
55.9
– – –
-199.5 -25.2
-14.8 1,067
741.4
–
100
8
Natural Intelligence
561.3
32.7
533.2
32.7
95.0
– –
– –
– –
122
9
Sizmek Technologies
341.0
-7.8
– – –
– –
–
272 1,253.6
Sizmek Technologies Inc.
181
10
Taptica International
294.7
30.5
274.5
32.8
93.1
8.4
2.8
176.7
–
– –
199
Company
Sales
Exports/Overseas Sales
Net Profit
Equity
Employees
Parent Company
MAIN
RANK
2016
Industry
Profile
NIS
Millions
Change
(%)
NIS
Millions
Change
(%)
% of Total
Sales
NIS
Millions
Profitability
(%)
NIS
Millions
No.
Sales per
Employee
NIS (000)
See
Page
rank 2016