


 122 / 730

A subsidiary of a ranked company |
Company shares are traded in Israel |
Company shares are traded abroad |
Estimated figures
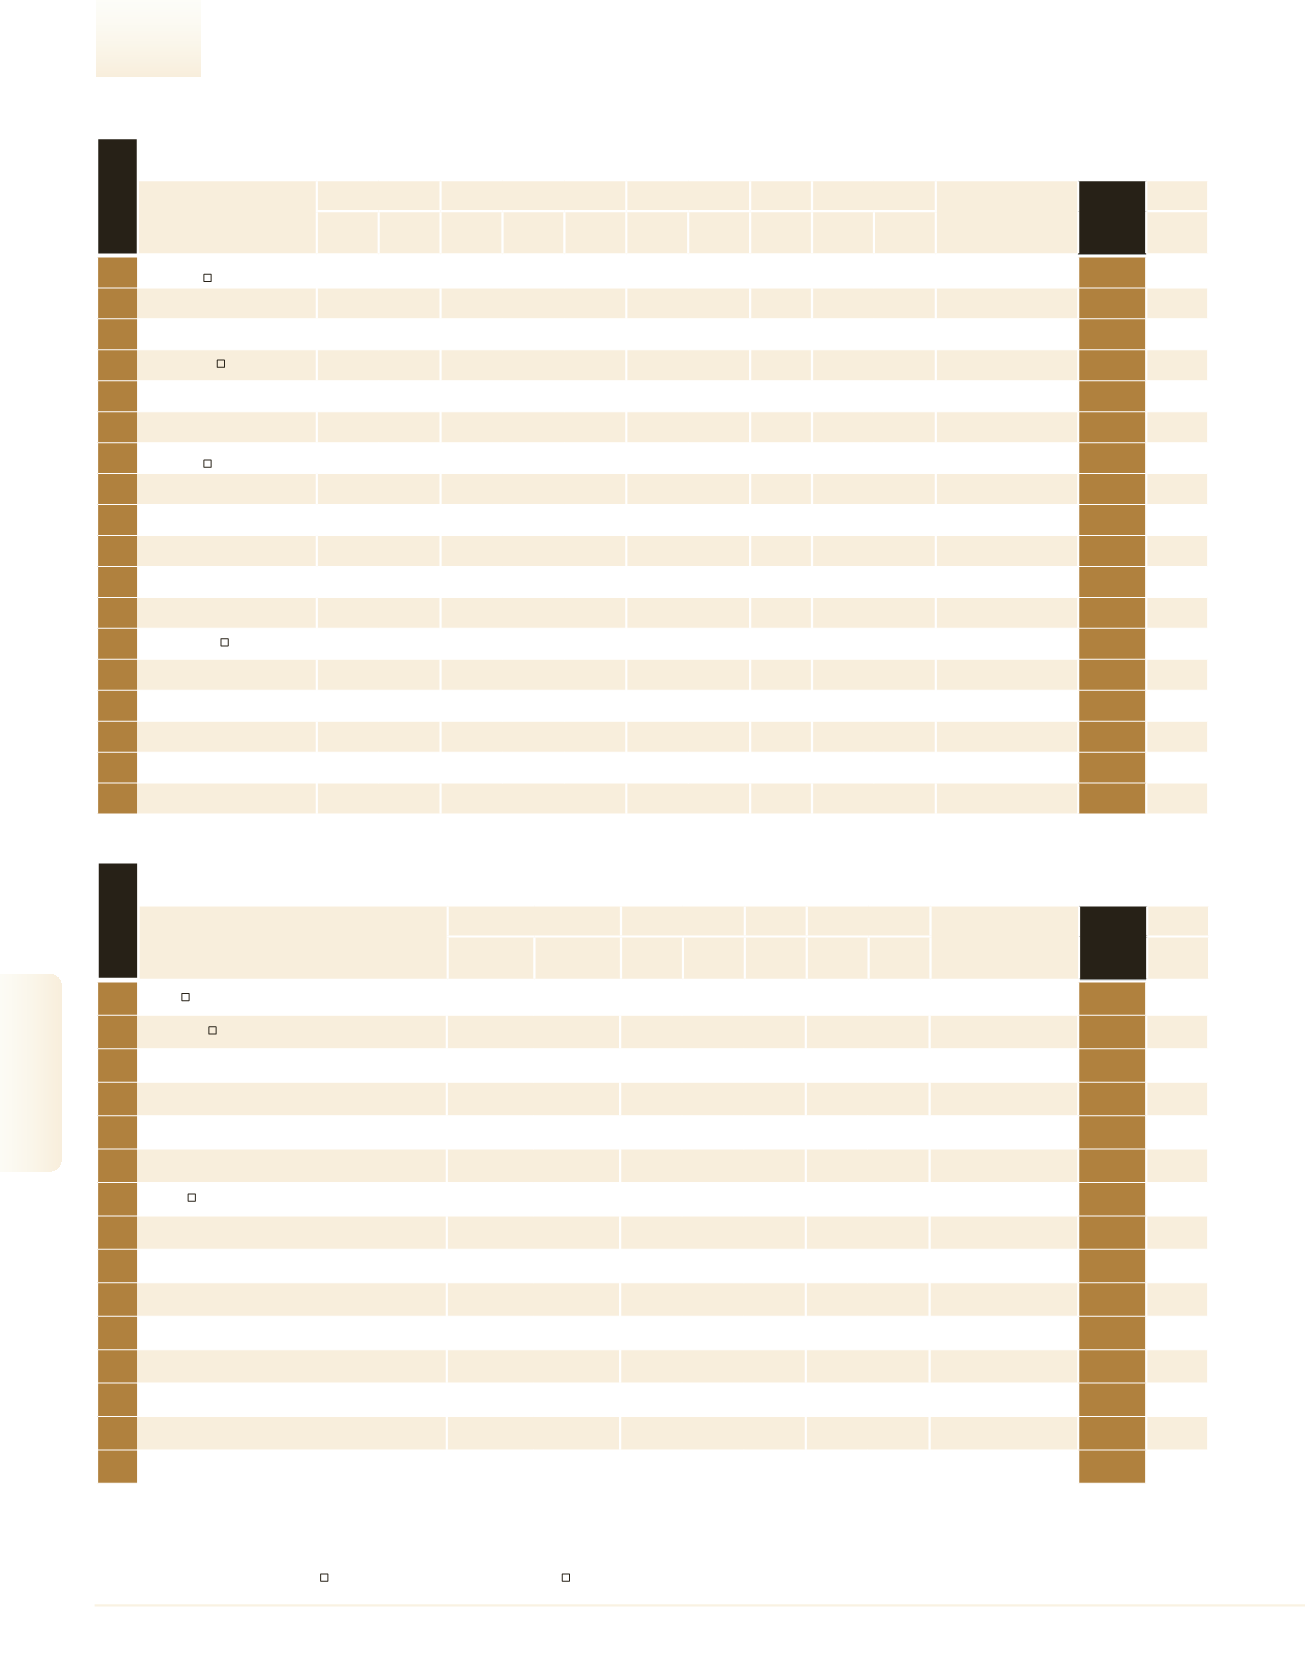
Construction & Real Estate Ranking
Largest in Building Products & Infrastructure
1
Shapir Engineering &
Industries
2,483.6
7.6
– – –
161.0
6.5
1,091.6 1,382 1,797.1
–
32
143
2
Nesher
2,120.7
3.5
– – –
– –
–
541 3,919.9
Mashav - Initiating &
Develop.
35
3
Readymix
1,966.0
1.8
– – –
– –
–
1,070 1,837.4
Cemex S.A. de C.V.
38
218
4
Caesarstone
1,941.6
21.3
1,787.5
23.0
92.1
302.3 15.6
1,561.7 1,282 1,514.5
–
39
5
Hanson Israel
1,054.3
-0.5
– – –
– –
–
598 1,763.0
Heidelberg Cement AG
70
219
6
Tambour
935.0
–
– – –
– –
–
740 1,263.5
Kusto Roofing PTE
80
7
Inrom Construction
Industries
874.7
5.0
20.1
-3.3
2.3
79.7
9.1
277.1
801 1,092.0
Inrom Industries
89
8
Negev
831.6
2.5
14.4 -46.9
1.7
-131.0 -15.8
-8.2
874
951.5
Africa Israel Industries
*
9
Ackerstein
567.0
4.1
58.0
3.0
10.2
– –
215.0
560 1,012.5
G.Ackerstein Holdings
121
220
10
Ashtrom Industries
505.1
6.5
– – –
– –
175.5
285 1,772.4
Ashtrom Group
133
11
Nirlat
396.5
0.2
– – –
– –
–
390 1,016.8
Inrom Investments Industry
*
12
Pazkar
305.0
–
– – –
– –
–
85 3,588.2
Paz Oil Company
194
13
Hamat Group
302.4
1.3
43.5
-1.2
14.4
33.7 11.2
122.1
383
789.5
–
195
14
Pandoor
275.0
7.4
– – –
– –
350.0
234 1,175.2
Garlam
207
221
15
Kfar Giladi Quarries
248.5
25.0
– – –
– –
104.2
130 1,911.6
–
220
16
Madan - Roads and Quarries
(1964)
170.0
25.9
– – –
– –
55.0
90 1,888.9
–
262
17
Wolfman Industries
167.0
7.7
– – –
– –
–
290
575.9
–
264
18
Shikun & Binui - Renewable
Energy
156.8
35.1
– – –
39.7 25.3
153.0
54 2,903.5
Shikun & Binui
270
135
Company
Sales
Exports/Overseas Sales
Net Profit
Equity
Employees
Parent Company
MAIN
RANK
2016
Industry
Profile
NIS
Millions
Change
(%)
NIS
Millions
Change
(%)
% of Total
Sales
NIS
Millions
Profitability
(%)
NIS
Millions
No.
Sales per
Employee
NIS (000)
See
Page
rank 2016
Construction Input, Metal, Plumbing And Wood
1
Scope
1,436.7
5.2
40.6
2.8
420.7
614 2,339.9
–
29
2
Mendelson
716.3
15.7
-5.1 -0.7
196.2
520 1,377.4
–
61
3
S. Cohen
465.0
–
– –
–
186 2,500.0
–
88
4
S. Al Bad Kal
430.0
22.9
– –
–
280 1,535.7
S.AlHoldings
95
5
A.A.A. Tassa
407.0
-1.5
– –
–
130 3,130.8
–
99
6
Shimon
400.0
14.3
– –
–
12 33,333.3
–
101
7
Birman
286.5
1.5
15.8
5.5
93.7
177 1,618.7
–
125
8
Ordilan Import & Marketing Co.
280.0
3.7
– –
–
160 1,750.0
Noam Wood & Building
Materials
126
9
Tuboul Building Supplies
256.0
13.8
– –
–
250 1,024.0
–
130
10
Averbuch Formica Center (Marketing)
255.5
11.2
– –
39.0
153 1,669.7
–
131
11
Hasson P.A.
211.0
-10.6
– –
136.0
210 1,004.9
Hason Mordehai Holdings
146
12
Mody Ceramic Import & Marketing
200.0
33.3
– –
–
179 1,117.3
–
151
13
Topolski & Co.
160.0
–
– –
39.0
150 1,066.7
–
167
14
Ashdod Timber Trade
150.0
–
– –
–
17 8,823.5
Nior Holdings (1994)
171
15
M. Bar Maintenance
130.0
11.1
– –
–
77 1,688.3
–
177
223
Company
Revenues
Net Profit
Equity
Employees
Parent Company
Main
Rank
2016
Trade
Profile
NIS
Millions
Change
(%)
NIS
Millions
Profitability
(%)
NIS
Millions
No.
Rev. per
Employee
NIS (000)
See
Page
rank 2016
122
2016
|
DUN’S
100
DUN’S
100
|
2016
DUN’S
100
|
2016
2016
|
DUN’S
100
Construction & Real Estate