


 123 / 730

A subsidiary of a ranked company |
Company shares are traded in Israel |
Company shares are traded abroad |
Estimated figures
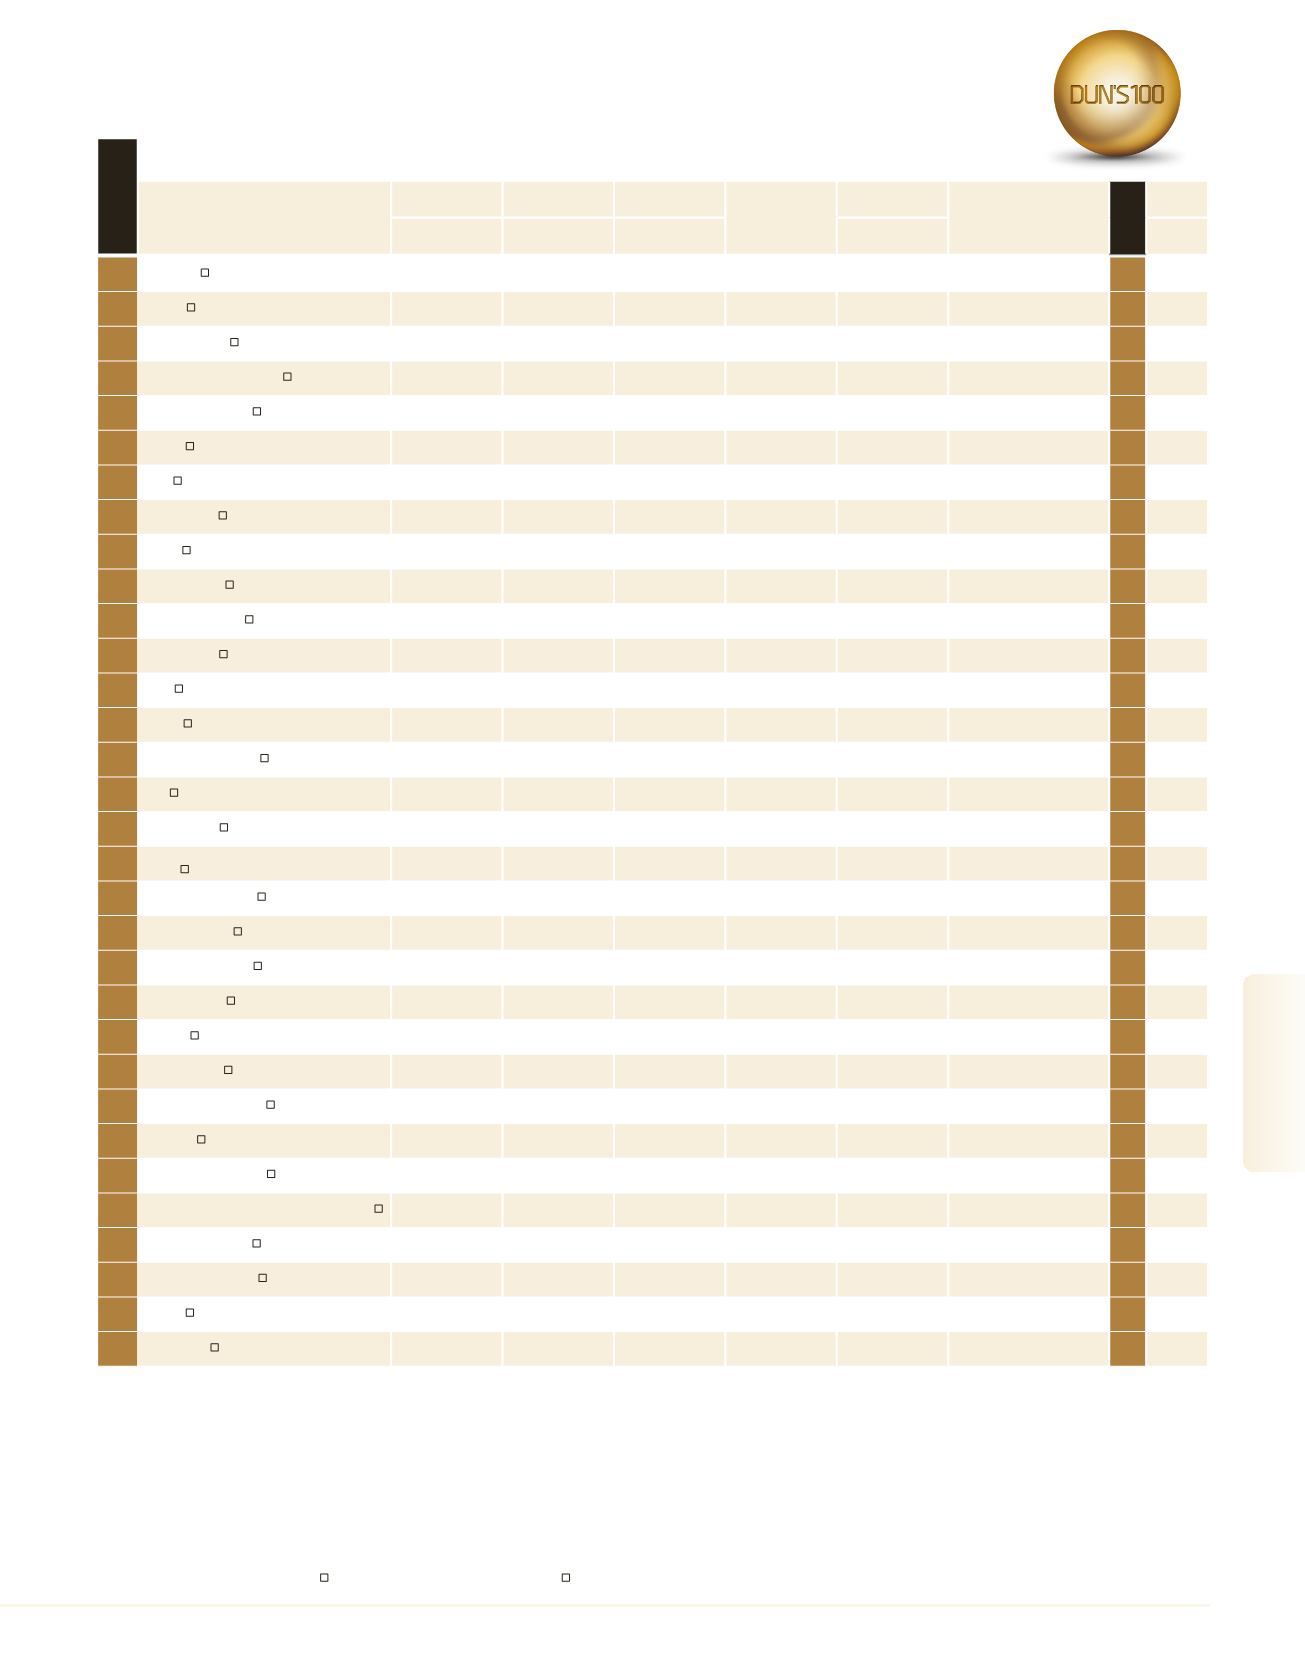
Real Estate Development - Listed Companies
1
Y.H. Dimri
974.3
1,006.4
2,207.7
0.65
214
–
2
182
2
Ashdar
892.8
899.2
1,600.9
0.63
73
Ashtrom Group
3
183
3
Shikun & Binui
807.9
5,068.7
3,016.8
0.79
8,194
–
1
130
4
Africa Israel Residences
685.8
743.9
2,568.7
0.63
57
Danya Cebus
4
185
5
Azorim Investment
637.5
644.4
2,757.1
0.62
92
Adarim star
5
188
6
Minrav
359.2
786.9
653.1
0.42
300
–
10
189
7
Aura
339.6
346.4
1,009.3
0.82
26
–
15
8
Dunietz Bros
470.7
470.7
548.5
0.69
141
–
16
190
9
B. Yair
327.0
532.9
760.7
0.55
49
–
6
194
10
Bonei Hatihon
291.4
291.4
859.4
0.79
71
–
17
195
11
Hanan Mor Group
356.6
356.6
534.4
0.81
29
Hanan Mor Group Investments
2006
13
196
12
Prashkovsky
298.2
321.5
693.2
0.79
62
–
11
13
Isras
260.6
603.0
903.7
0.60
134
Arad Investment & Industrial
Development
12
198
14
Zarfati
265.7
267.4
538.2
0.67
33
–
23
15
Jerusalem Economy
224.2
1,661.8
1,307.9
0.86
187
–
9
16
PBC
216.0
1,170.0
921.0
0.77
113
Discount Investment Co.
8
192
17
Hagag Group
262.9
262.9
531.9
0.70
2
–
–
18
Amos Luzon Entrepreneurship and Energy
Group
236.8
1,159.2
515.3
0.67
466
–
14
19
Z.M.H. Hammerman
137.4
241.2
697.3
0.71
424
–
21
200
20
Mordechai Aviv
167.0
176.6
516.2
0.65
367
–
22
201
21
Kardan Real Estate
144.2
501.7
484.0
0.35
88
Kardan Israel
7
202
22
Netanel Group
108.5
108.5
294.7
0.38
30
Rishan Building & Investments
18
23
Maslavi
79.8
190.1
533.7
0.76
74
–
25
203
24
Israel Canada
85.3
172.8
287.5
0.52
20
–
28
204
25
Meshulam Levinstein
77.5
284.2
503.1
0.53
66
–
19
205
26
Almogim
130.2
140.1
232.2
0.84
91
–
27
27
Rotshtein Real Estate
52.3
52.8
602.3
0.84
16
–
20
28
Neocity Group for Investments and Holdings
67.7
68.4
106.6
0.53
22
–
24
29
Electra Real Estate
55.7
100.3
111.1
0.69
9
Elco
26
30
Gindi Investments 1
70.9
70.9
35.6
0.94
9
Gindi Capital
31
31
Vitania
54.4
107.9
19.6
0.43
24
–
29
207
32
Oron Group
47.3
538.4
226.1
0.46
346
–
–
Company
Revenues from
Development
Total Revenues Real Estate
Inventory
Dept / Cap
Employees
Parent Company
Rank 2015
Profile
NIS Millions
NIS Millions
NIS Millions
Number
See
Page
rank 2016
123
2016
|
DUN’S
100
DUN’S
100
|
2016
DUN’S
100
|
2016
2016
|
DUN’S
100
Construction & Real Estate