


 124 / 730

A subsidiary of a ranked company |
Company shares are traded in Israel |
Company shares are traded abroad |
Estimated figures
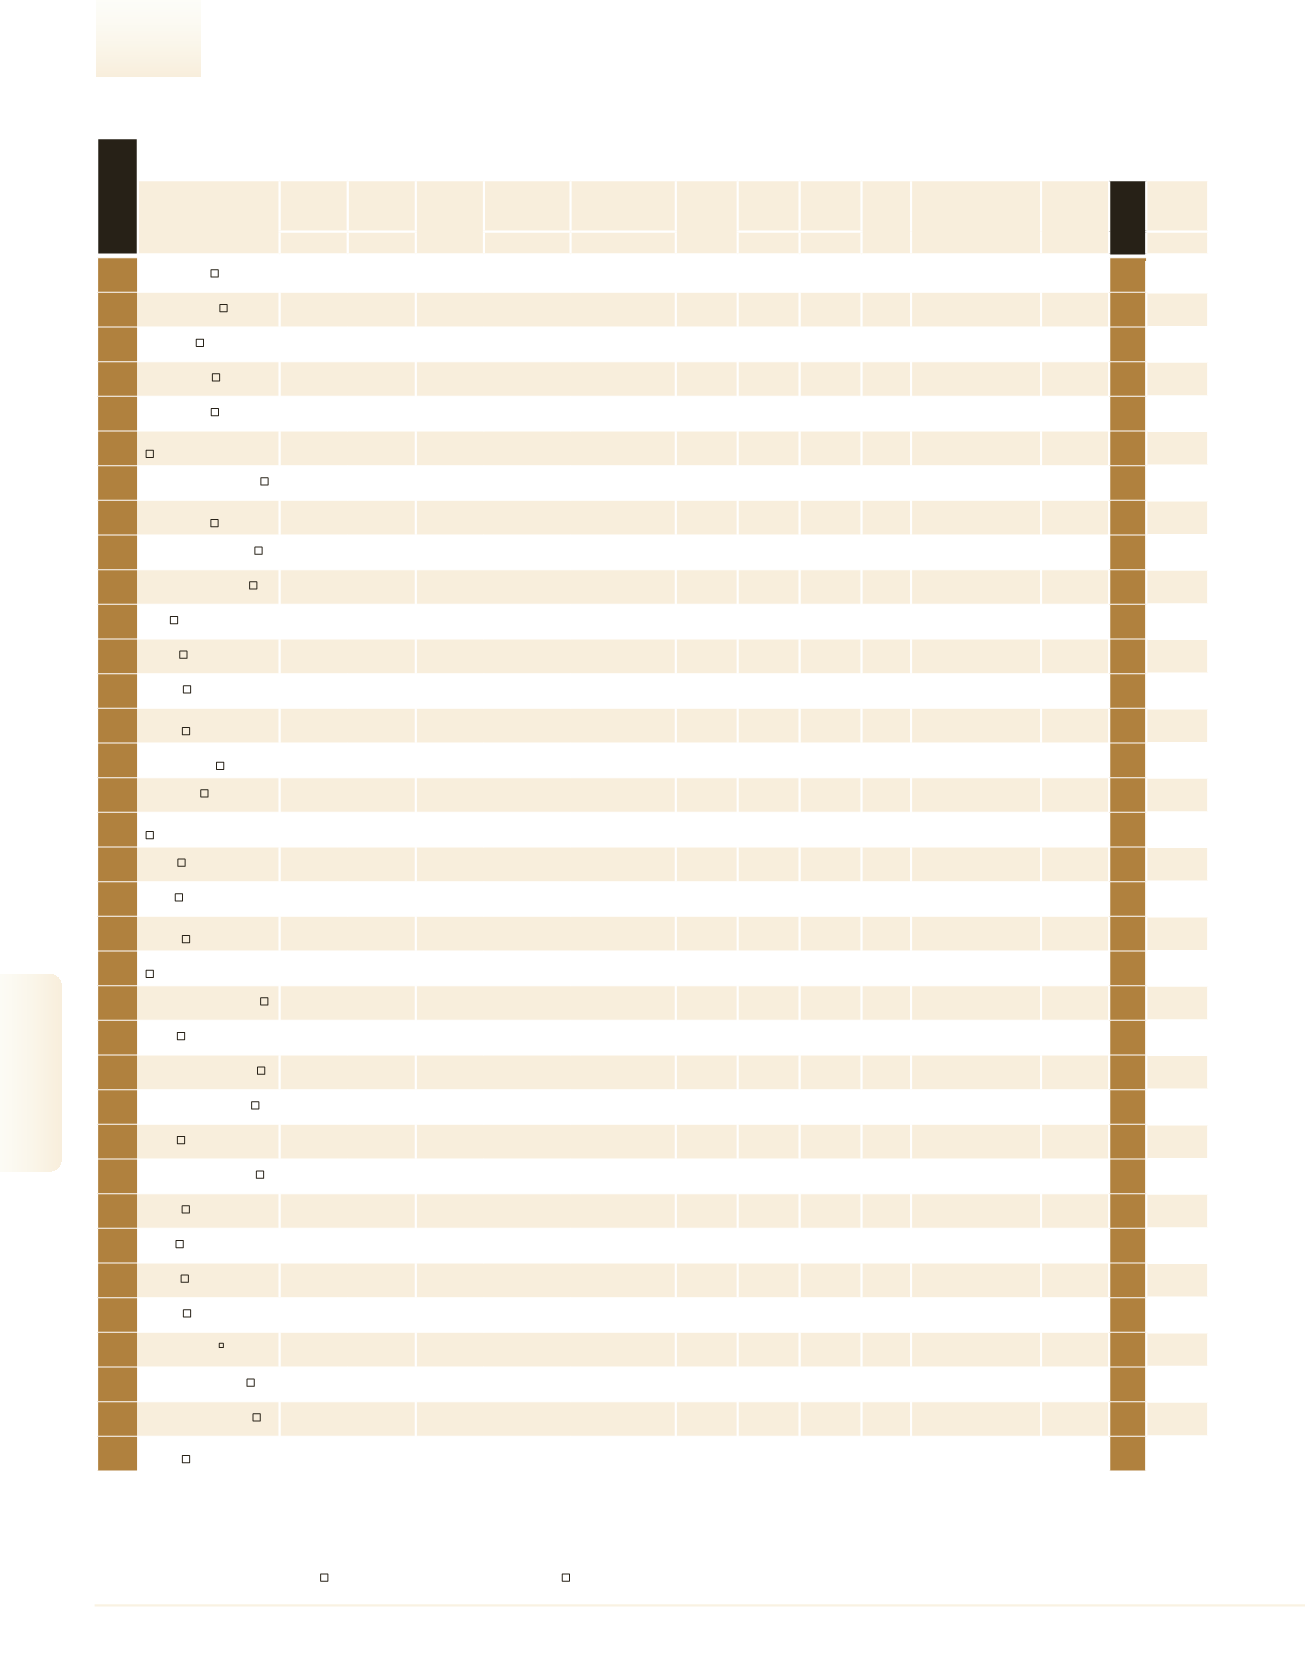
Construction & Real Estate Ranking
Yielding Real Estate Companies
1
Gazit Globe
6,150.0
7,303.0 3,935.7 6,600,000.0
932
627.0 84,236.0 30,995.0 0.4
–
1313
1
180
2
Azrieli Group
1,622.5
6,308.5 1,238.0
858,790.0
1,889
874.0 26,445.1 13,869.8 0.5
–
2722
2
3
Melisron
1,161.9
1,268.6 1,031.0
686,000.0
1,694
521.0 16,340.8 4,697.9 0.3
Ofer Investments
251
3
184
4
Alony-Hetz
545.6
1,324.3
480.4
662,399.0
824
314.9 15,593.9 6,057.6 0.4
–
115
5
186
5
Airport City
779.9
779.9
638.0 1,356,397.0
575
426.0 10,565.4 3,696.8 0.4
J.O.E.L. Jerusalem Oil
Exploration
19
6
6
Big Shopping Centers
607.9
614.9
455.7
602,185.0
1,009
207.8 8,052.7 2,494.1 0.3
–
65
8
7
Jerusalem Economy
1,318.4
1,661.8
951.1 3,370,076.0
391
62.7 18,214.3 2,154.0 0.1
–
187
4
*
Industrial Buildings
Corp. - IBC
579.1
594.9
447.4 1,712,538.0
338
129.9 7,943.5 1,355.2 0.2
Jerusalem Economy
129
*
8
Al-Rov Real Estate
379.3
1,122.3
307.9
367,188.0
1,033
–
11,914.2 3,622.3 0.3
Akirov Holdings (1999)
1790
10
191
*
Amot Investments
547.6
547.6
512.0 1,100,000.0
498
322.6 8,717.2 3,256.1 0.4
Alony-Hetz Properties &
Investments
46
*
187
9
PBC
818.0
1,170.0
653.0 1,288,000.0
635
–
15,158.0 2,960.0 0.2
Discount Investment Co.
113
7
192
10
Reit 1
225.4
225.4
216.0
370,636.0
608
163.5 3,362.2 1,645.0 0.5
–
–
12
*
Nitsba
514.1
514.1
399.6 1,073,244.0
479
254.8 7,815.8 3,713.7 0.5
Airport City
166
*
11
Blue Square Real
Estate
230.8
230.8
239.7
280,070.0
824
119.0 3,976.8 1,570.5 0.4
Alon Blue Square Israel
17
14
197
12
Lodzia - Rotex
Investments
11.3
148.0
10.8
18,803.0
599
5.1
322.8 242.4 0.8
–
4
15
*
Gav-Yam
402.9
616.3
386.5
859,328.0
469
158.9 6,389.6 2,424.1 0.4
PBC
40
*
193
13
Africa Israel Properties
366.5
645.5
380.9
533,847.0
686
–
7,690.0 2,598.9 0.3
Africa Israel Investments
187
11
199
14
A.D.O
265.5
325.8
231.4 1,037,600.0
256
61.6 7,985.6 3,706.5 0.5
–
233
26
15
Isras
336.3
603.0
271.9
592,928.0
567
138.4 5,514.9 1,882.7 0.3
Arad Investment &
Industrial Development
134
16
198
16
Sella Capital Real
Estate
131.6
131.6
113.9
168,100.0
783
66.9 1,877.3 913.7 0.5
–
2
17
17
Levinstein Properties
60.0
160.6
60.0
70,002.0
858
28.5 1,226.4 595.1 0.5
Meshulam Levinstein
Contracting & Engineering
5
13
*
Darban Investments
243.1
256.9
177.7
472,837.0
514
52.9 3,798.9 1,202.9 0.3
Jerusalem Economy
70
*
18
Hiron
52.5
145.7
45.9
118,033.0
445
–
755.9 501.4 0.7
–
8
18
19
Summit Real Estate
250.0
250.0
230.4
946,244.0
264
79.8 4,035.5 1,982.0 0.5
–
80
24
20
Villar International
106.2
337.1
96.0
299,943.0
354
–
2,201.9 1,316.1 0.6
–
333
19
21
Giron
78.5
78.5
62.8
80,420.0
976
31.1 1,012.4 362.8 0.4
Destiny Global
36
21
22
Ashtrom Properties
230.2
246.2
185.5
431,261.0
534
112.1 3,583.2 1,132.4 0.3
–
46
22
23
Ravad
29.4
29.4
38.6
52,270.0
563
15.2
624.4 272.8 0.4
–
6
27
24
Ispro
80.9
81.6
67.9
119,933.0
674
26.0 1,338.2 436.2 0.3
–
26
25
25
Adgar
202.1
246.5
186.1
338,639.0
597
42.7 3,858.8 830.9 0.2
Yashir I.D.I. Holdings
63
23
26
Dorsel
45.4
69.2
33.2
70,033.0
648
15.7
462.0 171.5 0.4
Synel M.L.L Payway
8
33
27
Aspen Group
160.0
192.2
140.1
367,911.0
435
68.8 2,470.1 502.2 0.2
–
31
32
206
28
Mega Or Holdings
44.5
44.5
68.4
119,589.0
372
29.2 1,468.4 471.6 0.3
–
21
29
29
Electra Real Estate
44.6
100.3
45.1
87,816.0
508
5.6 1,298.6 357.6 0.3
Elco
9
28
30
SHIR Shlomo Real
Estate
55.8
108.4
42.6
208,634.0
268
22.8 1,258.4 316.9 0.3
–
10
34
Company
Rev from
Yielding
operations
Total
Revenues NOI (Total)
Yielding
assets
Rev from Yielding
operations / Sqm FFO
Total
assets
Total
Equity Assets
/ Equity Parent Company Employees
number
Rank 2015
Profile
NIS Millions NIS Millions
Total Sqm
NIS Millions
NIS Millions NIS Millions
See Page
rank 2016
124
2016
|
DUN’S
100
DUN’S
100
|
2016
DUN’S
100
|
2016
2016
|
DUN’S
100
Construction & Real Estate