


 28 / 730

A subsidiary of a ranked company |
Company shares are traded in Israel |
Company shares are traded abroad |
Estimated figures
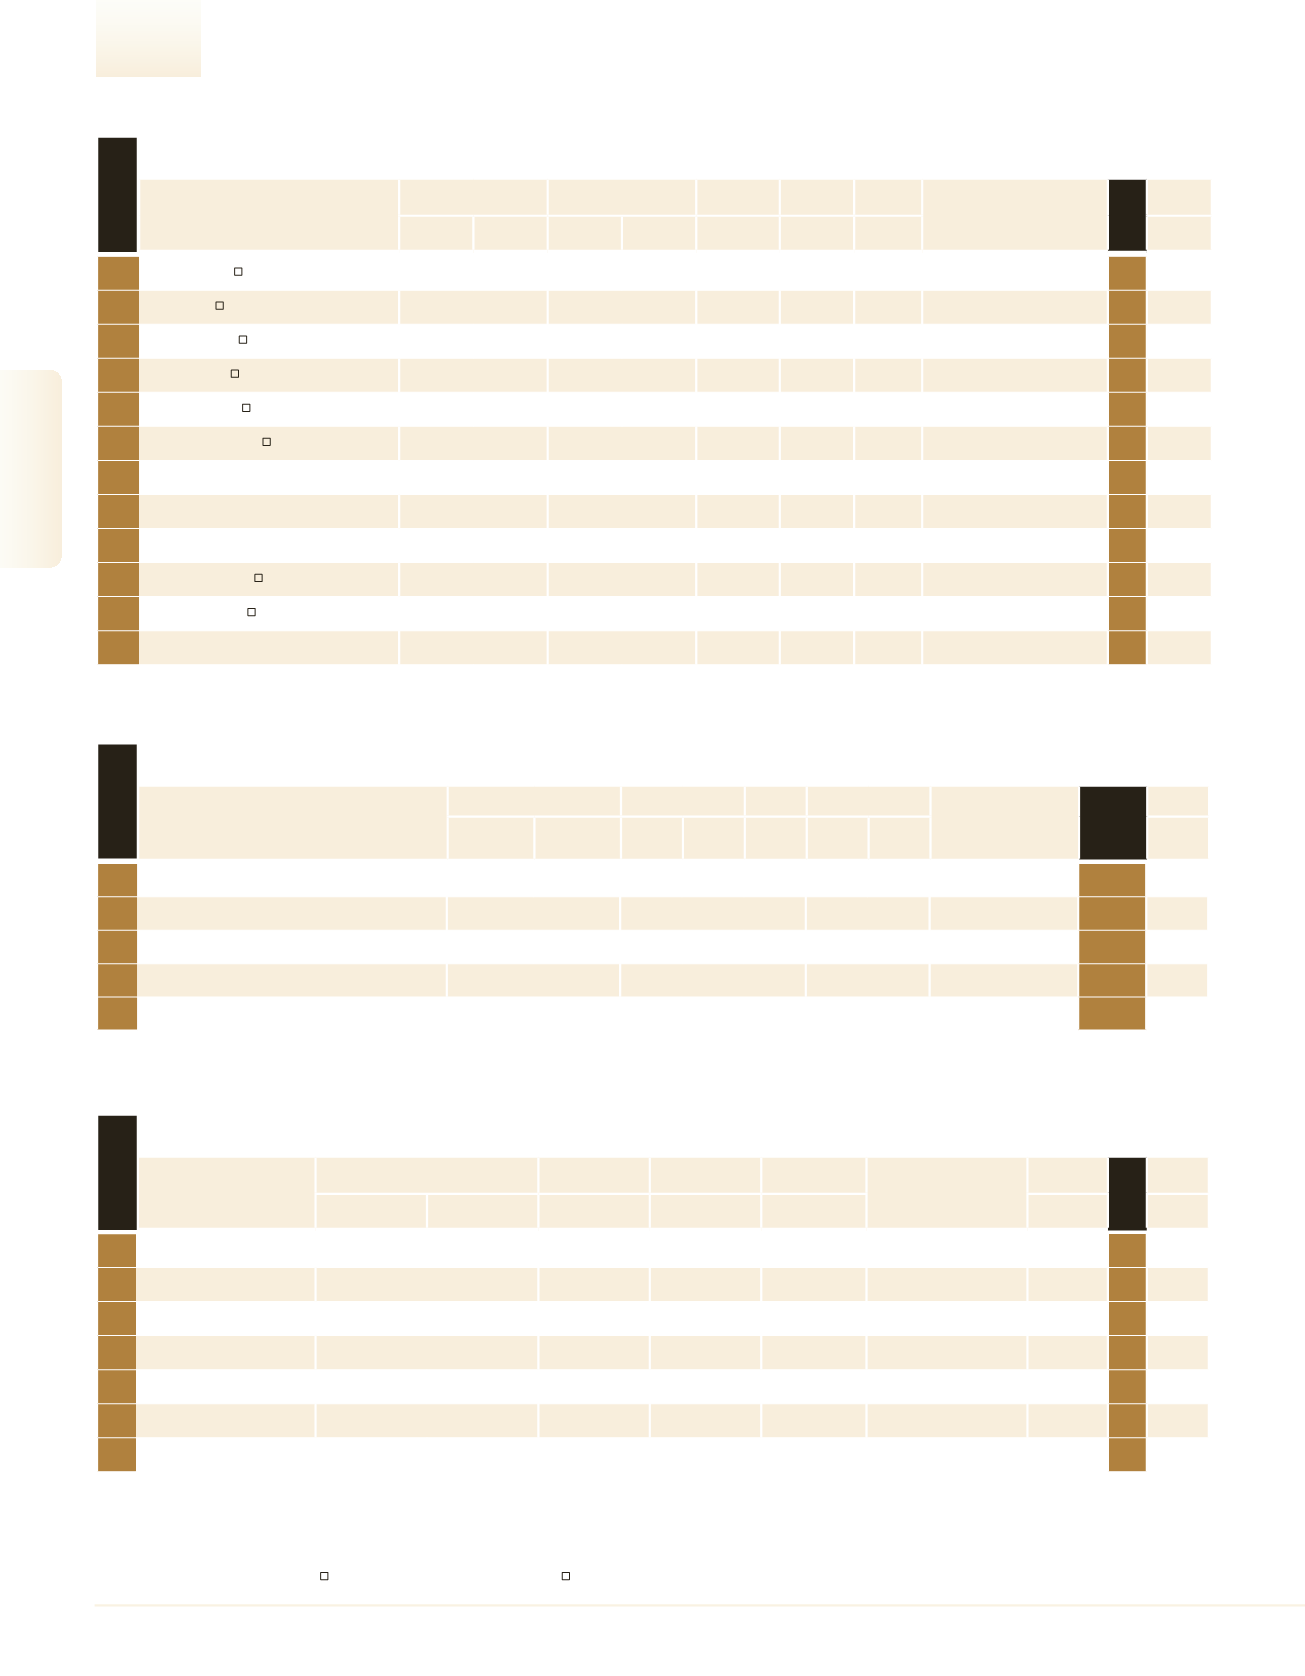
Financial Services Ranking
Commercial Banks
1
Bank Hapoalim
431,638.0
5.8
278,497.0
5.5
33,032.0
3,082.0
11,930
–
1
31
2
Bank Leumi
416,499.0
4.9
261,399.0
3.5
28,767.0
2,835.0
12,528
–
2
34
3
Mizrahi Tefahot
209,158.0
5.4
159,204.0
7.9
11,847.0
1,134.0
6,047
–
4
38
4
Discount Bank
205,260.0
-0.9
127,216.0
5.9
13,288.0
750.0
9,068
–
3
39
5
FIBI - Beinleumi
125,476.0
6.5
72,555.0
5.3
7,073.0
446.0
4,682
–
5
40
6
Union Bank of Israel
40,895.0
0.1
22,315.0
2.8
2,410.0
144.0
1,257
–
6
*
Mercantile Discount Bank
30,076.0
5.3
20,417.0
7.9
2,103.0
210.0
1,603
Israel Discount Bank
*
*
Yahav Bank
22,650.6
8.8
7,943.2
8.8
1,133.6
120.4
820
Mizrahi Tefahot + Company For
Economic & Cultural Projects
*
42
*
Bank Otsar Ha-Hayal
19,172.0
13.5
11,791.4
3.9
1,164.7
65.6
808
FIBI - Beinleumi
*
7
Bank of Jerusalem
14,219.5
1.0
9,889.3
3.4
784.0
48.6
607
Export Investment Co.
7
8
Dexia Israel Bank
9,085.3
-3.5
6,190.8
-0.2
887.9
58.8
45
Dexia Credit Local
8
*
Bank Massad
6,421.0
12.6
3,475.0
9.2
537.6
36.5
318
FIBI - Beinleumi
*
Bank
Total Assets
Loans to the Public
Equity
Net Profit Employees
Parent Company
Rank 2015
Profile
NIS
Millions
Change
(%)
NIS
Millions
Change
(%)
NIS
Millions
NIS
Millions
No.
See
Page
rank 2016
Credit cards
1
Isracard
1,590.0
1.7
251.0 15.8
2,456.0
1,267 1,254.9
Bank Hapoalim
17
43
2
CAL
1,240.0
8.0
149.0 12.0
1,225.0
1,313
944.4
Israel Discount Bank
20
44
3
Leumi Card
1,054.0
3.8
180.0 17.1
1,661.0
1,231
856.2
Leumi Finance Holdings
30
45
4
American Express
367.0
8.6
40.0 10.9
332.0
164 2,237.8
Bank Hapoalim
60
5
Gama
335.4
–
– –
–
95 3,530.4
–
67
46
Company
Revenues
Net Profit
Equity
Employees
Parent Company
Main
Rank
2016
SERVICES
Profile
NIS
Millions
Change
(%)
NIS
Millions
Profitability
(%)
NIS
Millions
No.
Rev. per
Employee
NIS (000)
See
Page
rank 2016
Insurance Agencies
1
Mivtach Simon
179.2
-0.0
3,650.0
–
3,650.0
Migdal Holdings (100%)
624
1
2
Madanes
138.0
12.2
640.0
462.0
1,102.0
Harel Investments (24.7%)
450
2
3
Agam Leaders
131.2
14.6
2,400.0
–
2,400.0
The Phoenix (60%)
287
4
4
Shekel Group
120.0
–
2,637.8
–
–
The Phoenix 100%)
365
3
49
5
Tmura Insurance Agency
88.0
7.3
2,485.0
–
2,485.0
Clal Insurance Holdings (100%)
308
5
6
Ramot Insurance Agencies
46.1
9.1
–
465.9
465.9
–
103
6
7
Sagi-Yogev
38.5
–
1,600.0
–
–
Migdal Holdings (100%)
130
7
50
Agency
Income from
Commissions
Premiums from
Life Insurance
Premiums from
General Insurance Premiums
In Ownership Relations
with Insurance Company
Employees
Rank 2015
Profile
NIS Millions
Change (%)
NIS Millions
NIS Millions
NIS Millions
No.
See
Page
rank 2016
28
2016
|
DUN’S
100
DUN’S
100
|
2016
DUN’S
100
|
2016
2016
|
DUN’S
100
Financial Services