


 90 / 730

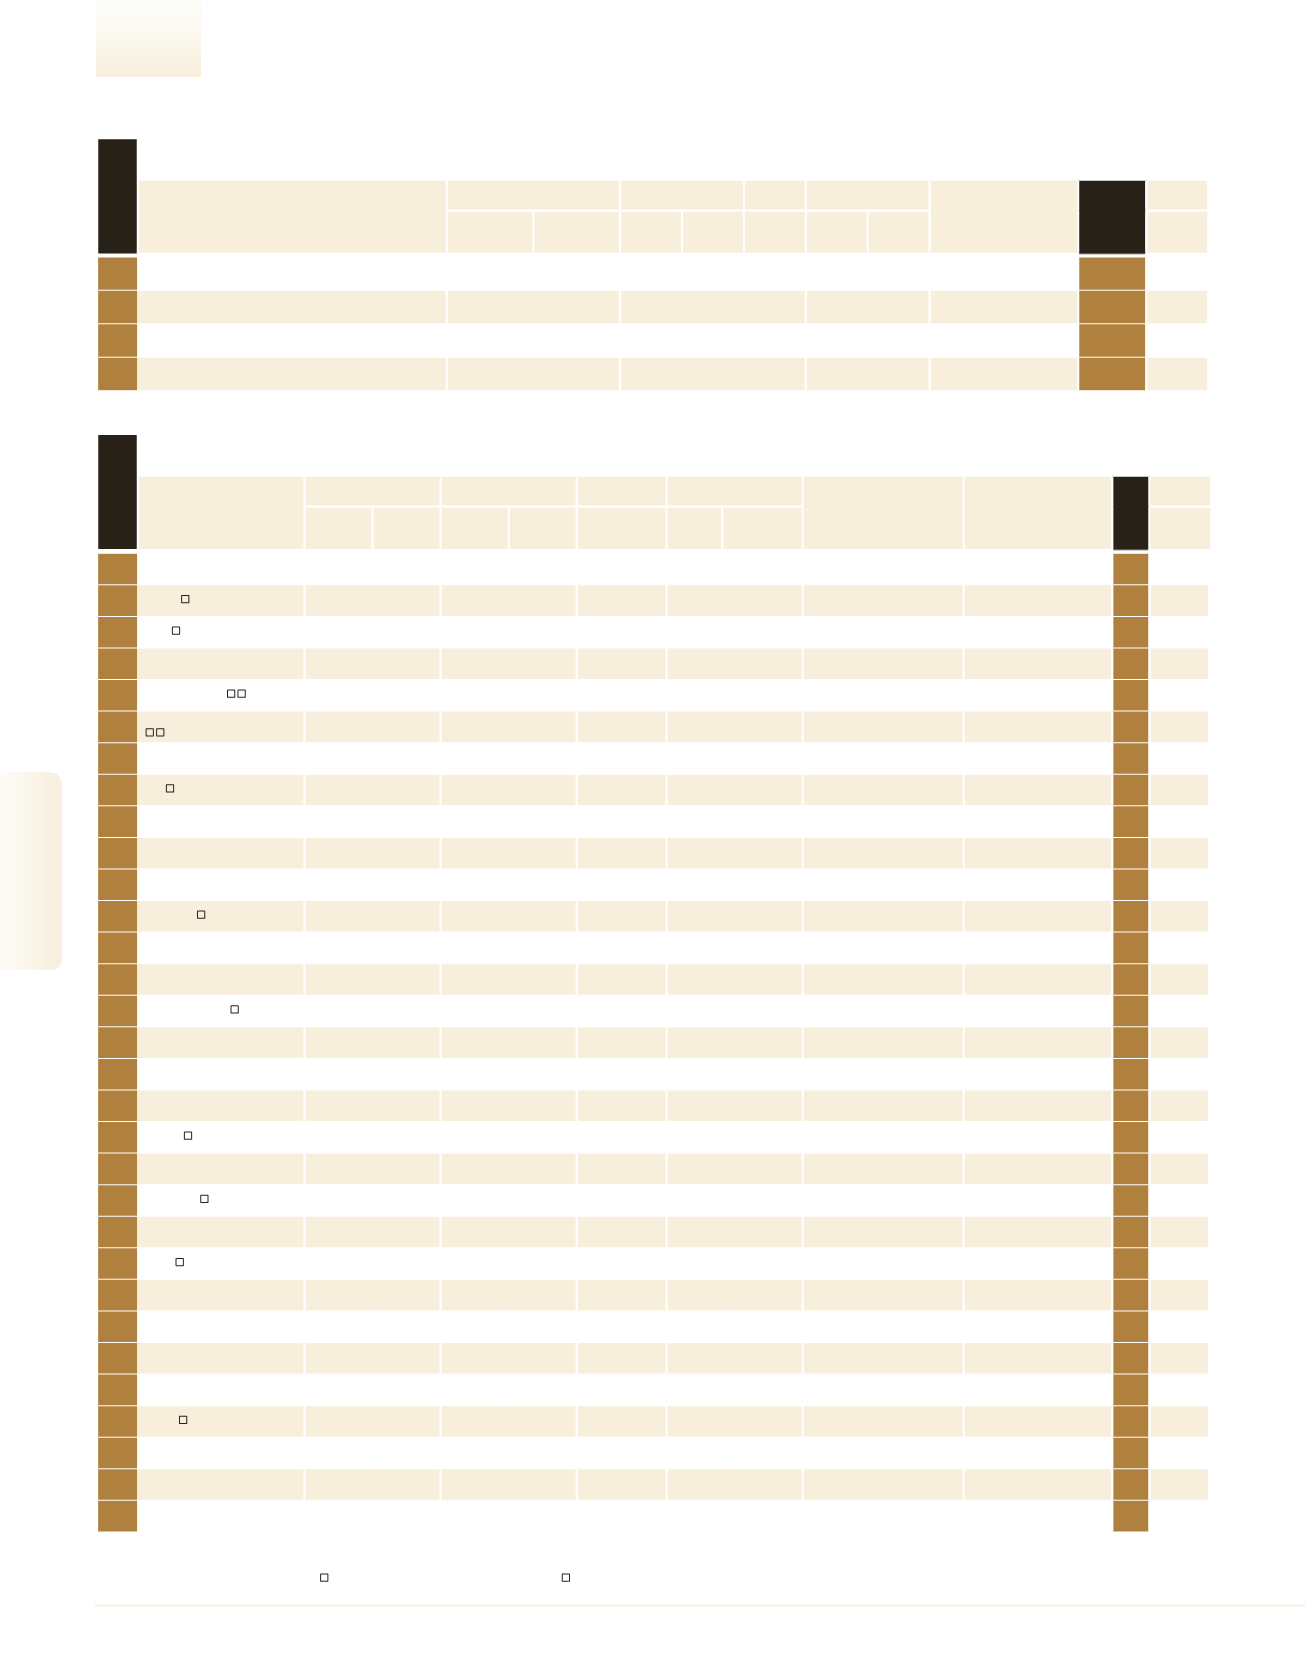
A subsidiary of a ranked company |
Company shares are traded in Israel |
Company shares are traded abroad |
Estimated figures
Furniture And Home Appliances
1
Ikea Israel
1,150.0
–
– –
–
1,400
821.4
Havatzelet Hagilboa
35
2
Home Center
823.0
-14.1
– –
–
1,600
514.4
–
51
3
Carmel Holdings (Betili)
300.0
–
– –
–
600
500.0
–
120
4
E.F. Design
197.0
-3.0
– –
–
300
656.7
F.C.P. Design + Ikoo Design
155
Company
Revenues
Net Profit
Equity
Employees
Parent Company
Main
Rank
2016
Trade
Profile
NIS
Millions
Change
(%)
NIS
Millions
Profitability
(%)
NIS
Millions
No.
Rev. per
Employee
NIS (000)
See
Page
rank 2016
Largest Services Companies
1
ZIM
11,626.2
-4.7
25.4
0.2
306.1
4,050
2,870.7
–
Transportation Services
1
2
Bezeq
9,985.0
10.3 1,721.0
17.2
2,411.0 12,615
791.5
–
Communication Groups
2
3
El Al
7,983.9
7.2
414.1
5.2
760.0
6,109
1,306.9
–
Transportation Services
3
4
Mifal Hapais
6,882.1
10.3
–
–
225.0
271
25,395.4
–
Lotteries
4
5
Cellcom Israel
4,180.0
-8.5
97.0
2.3
1,185.0
3,645
1,146.8
–
Communication Groups
6
560
6
Partner Communications
4,111.0
-6.6
-40.0
-1.0
1,020.0
2,882
1,426.4
–
Communication Groups
7
7
Israel Railways
4,002.0
-26.5
–
–
1.0
3,216
1,244.4
State of Israel
Transportation Services
5
8
Hot
3,974.0
-2.0
7.0
0.2
1,602.0
1,699
2,339.0
–
Communication Groups
8
9
Taavura
2,841.0
15.7
–
–
–
3,438
826.4
A. Livnat + Nesher Cement
Transportation Services
10
10
IBM Israel
2,750.0
–
–
–
–
2,650
1,037.7
IBM Corp.
Software Services
9
11
The Israel Sports Betting
Board
2,678.5
14.1
–
–
79.9
159
16,846.2
–
Lotteries
12
12
Matrix IT
2,280.2
8.5
99.8
4.4
623.8
7,644
298.3
Formula Systems (1985)
Software Services
13
13
Egged
2,203.8
-7.8
–
–
–
6,142
358.8
–
Transportation Services
11
14
Israel Post
1,841.6
3.9
–
–
362.3
5,500
334.8
State of Israel
General Services
14
15
Malam - Team
1,745.0
-0.9
50.1
2.9
360.1
2,888
604.2
–
Integration
15
520
16
Dan Transportation
1,700.0
–
–
–
–
2,500
680.0
–
Transportation Services
17
17
Isracard
1,590.0
1.7
251.0
15.8
2,456.0
1,267
1,254.9
Bank Hapoalim
Credit Cards
18
43
18
Assuta
1,500.0
3.4
–
–
–
2,968
505.4
Maccabi Healthcare Services
Medical Services
19
19
One-1
1,269.2
7.8
66.3
5.2
230.2
3,225
393.5
Computer Direct Group
Software Services
22
20
CAL
1,240.0
8.0
149.0
12.0
1,225.0
1,313
944.4
Israel Discount Bank
Credit Cards
24
44
21
Mehadrin
1,214.0
1.4
5.3
0.4
434.9
439
2,765.3
–
Export Companies
21
22
Bynet Data Communication 1,200.0
9.1
–
–
–
1,100
1,090.9
–
Integration
26
23
Hilan
1,167.9
124.5
66.8
5.7
199.3
2,817
414.6
–
Software Services
46
24
Manpower
1,136.8
3.0
–
–
–
450
2,526.3
Manpower Israel Holdings
(1999)
Human Resources
Companies
25
25
Derech Eretz
1,132.3
-17.2
199.0
17.6
-43.1
17
66,603.4
–
Transportation Infrastructure
20
533
26
Flying Carpet
1,111.4
-0.3
–
–
–
226
4,917.8
I.D.D Investments
Travel & Tourism Agents
28
27
Ashdod Port
1,094.0
–
–
–
–
1,364
802.1
State of Israel
Transportation Infrastructure
27
532
28
Danel
1,081.7
8.9
54.1
5.0
138.2
2,621
412.7
D.B.S.I Investments
Human Resources
Companies
30
29
ISS Israel
1,055.0
-8.3
–
–
–
8,400
125.6
ISS A/S
Security, Guarding and
Cleaning
23
30
Leumi Card
1,054.0
3.8
180.0
17.1
1,661.0
1,231
856.2
Leumi Finance Holdings
Credit Cards
29
45
31
Arkia
971.7
–
–
–
–
800
1,214.7
Kanaf Arkia Airlines & Aviation
Services
Transportation Services
-
Company
Revenues
Net Profit
Equity
Employees
Parent Company
Sector
Rank 2015
Profile
NIS
Millions
Change
(%)
NIS
Millions
Profitability
)NetProfit of
TotalSales)%
NIS
Millions
No.
Rev. per Employ-
ee NIS (000)
See
Page
rank 2016
Service & Trade Ranking
90
2016
|
DUN’S
100
DUN’S
100
|
2016
DUN’S
100
|
2016
2016
|
DUN’S
100
Service & Trade