


 15 / 730

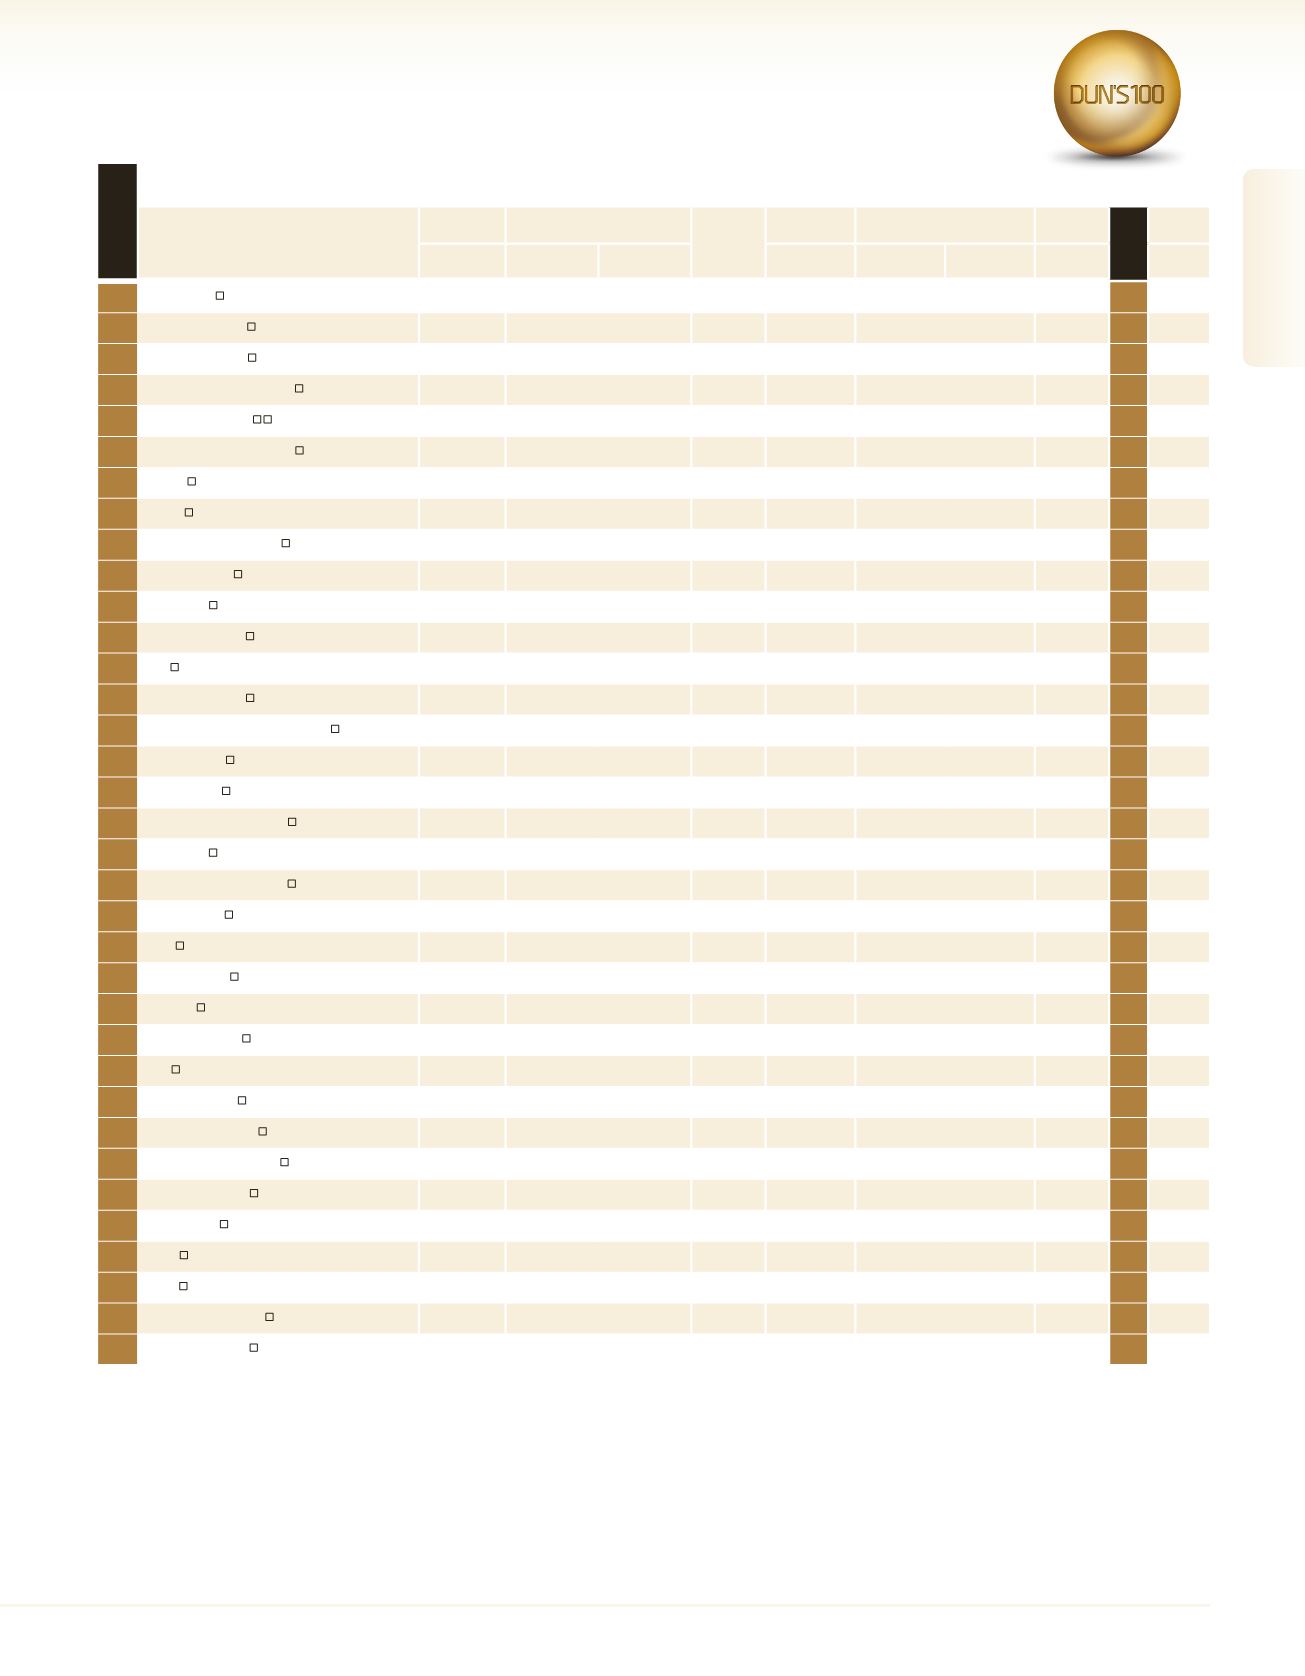
Holding & Investment
Companies
Holding, Management & Investment Companies By Balance
1
Delek Group
127,023.0
4,486.0
-13.8
20
7.0
6,356.0
-18.8
30
1
18
2
F.I.B.I. Holding Co.
125,488.0
3,424.0
4.0
5
216.0
3,497.0
-7.2
–
2
3
Israel Corporation
42,090.9
3,749.8
-47.4
1
1,710.2
21,008.7
-3.9
13
3
4
Discount Investment Corp.
36,193.0
1,310.0
6.9
10
72.0
18,110.0
-10.5
28
4
5
B Communications
22,122.0
1,045.0
8.7
6
210.0
9,985.0
10.3
4
6
6
Africa Israel Investments
1
21,421.8
1,318.8
-55.6
34
-1,751.9
5,782.7
-8.7
44
5
20
7
J.O.E.L.
17,718.2
2,156.3
6.0
3
258.9
2,613.6
2.9
–
7
8
Ekvitel
17,662.0
984.5
9.9
8
145.8
2,613.2
2.9
–
8
9
Export Investment Corp.
14,230.9
503.8
5.4
14
27.1
436.4
-2.3
12
9
10
Elezra Holdings
12,885.4
188.3
35.7
15
25.5
4,239.8
3.4
2
10
11
Zur Shamir
8,951.4
319.8
-12.3
12
45.4
2,214.5
9.9
10
12
12
Knafaim Holdings
8,086.2
361.9
90.7
7
169.5
8,219.3
7.3
8
15
13
Elco
7,714.9
719.6
-7.6
13
40.4
7,580.4
13.3
15
13
14
Arad Investments
6,725.6
1,387.5
15.5
4
220.4
2,597.1
9.8
3
16
15
The Israel Land Development Co.
4,145.7
705.7
-4.4
11
64.4
747.4
5.7
–
17
16
Arko Holdings
1,618.1
162.3
6.9
22
3.7
6,754.5
6.9
4
20
17
Kardan Israel
1,463.0
419.7
-0.2
16
25.2
558.3
-40.4
22
18
18
Mivtach Shamir Holdings
1,362.4
1,139.7
33.6
2
464.2
24.0
-43.3
7
22
19
Netz Group
1,288.1
117.4
-17.9
33
-58.0
42.7
-0.2
6
19
20
Hamashbir 365 Holdings
1,034.9
131.6
27.2
27
-4.3
2,368.0
0.3
12
21
22
21
Inter-Gamma
871.8
18.0
-79.0
32
-49.5
573.4
11.1
3
23
22
Elron
838.4
617.3
1.8
19
9.5
165.5
-73.9
–
25
23
Kerur Holdings
754.8
441.4
7.2
9
87.0
913.0
-0.2
14
24
24
Tiv Taam
595.8
164.2
12.9
18
22.1
1,289.9
9.2
17
27
25
B. Gaon Holdings
574.7
48.3
1.8
25
-4.0
393.7
-4.1
5
26
26
I.E.S
500.5
369.3
1.2
17
23.8
64.9
-13.1
5
29
27
Leader Holdings
434.2
140.3
-4.1
21
5.6
128.7
3.0
8
28
28
Emilia Development
382.3
199.3
-3.8
23
0.2
249.4
-7.3
3
30
*
Rapac Communications
371.3
73.4
-59.3
*
-104.0
181.6
-2.6
7
*
29
Eldav Investments
223.2
113.1
-11.2
29
-8.0
115.0
133.5
3
31
30
Vision Sigma
165.2
86.0
-15.6
31
-14.0
-2.0
-108.2
9
32
31
Tedea
156.2
77.0
-19.4
30
-13.0
69.7
2.9
3
33
32
Teuza
112.6
104.6
0.1
24
-2.9
2.4
567.6
–
34
33
Ybox Real Estate Ltd.
103.1
102.5
-5.4
26
-4.0
–
–
6
35
34
Dolomite Holdings
37.1
23.3
-43.5
28
-6.5
1.8
-57.1
3
36
1
- The company has a going concern notice in its audited financial reports for 2015.
Company
Balance
Equity
Secondary
Rank
2016 by Net
Profit
Net Profit
Revenues
Employees
Rank 2015
Profile
NIS
Millions
NIS
Millions
Change
(%)
NIS
Millions
NIS
Millions
Change
(%)
Number
See
Page
rank 2016
15
2016
|
DUN’S
100
DUN’S
100
|
2016
DUN’S
100
|
2016
2016
|
DUN’S
100