


 14 / 730

Holding & Investment Companies
Holding & Investment
Companies
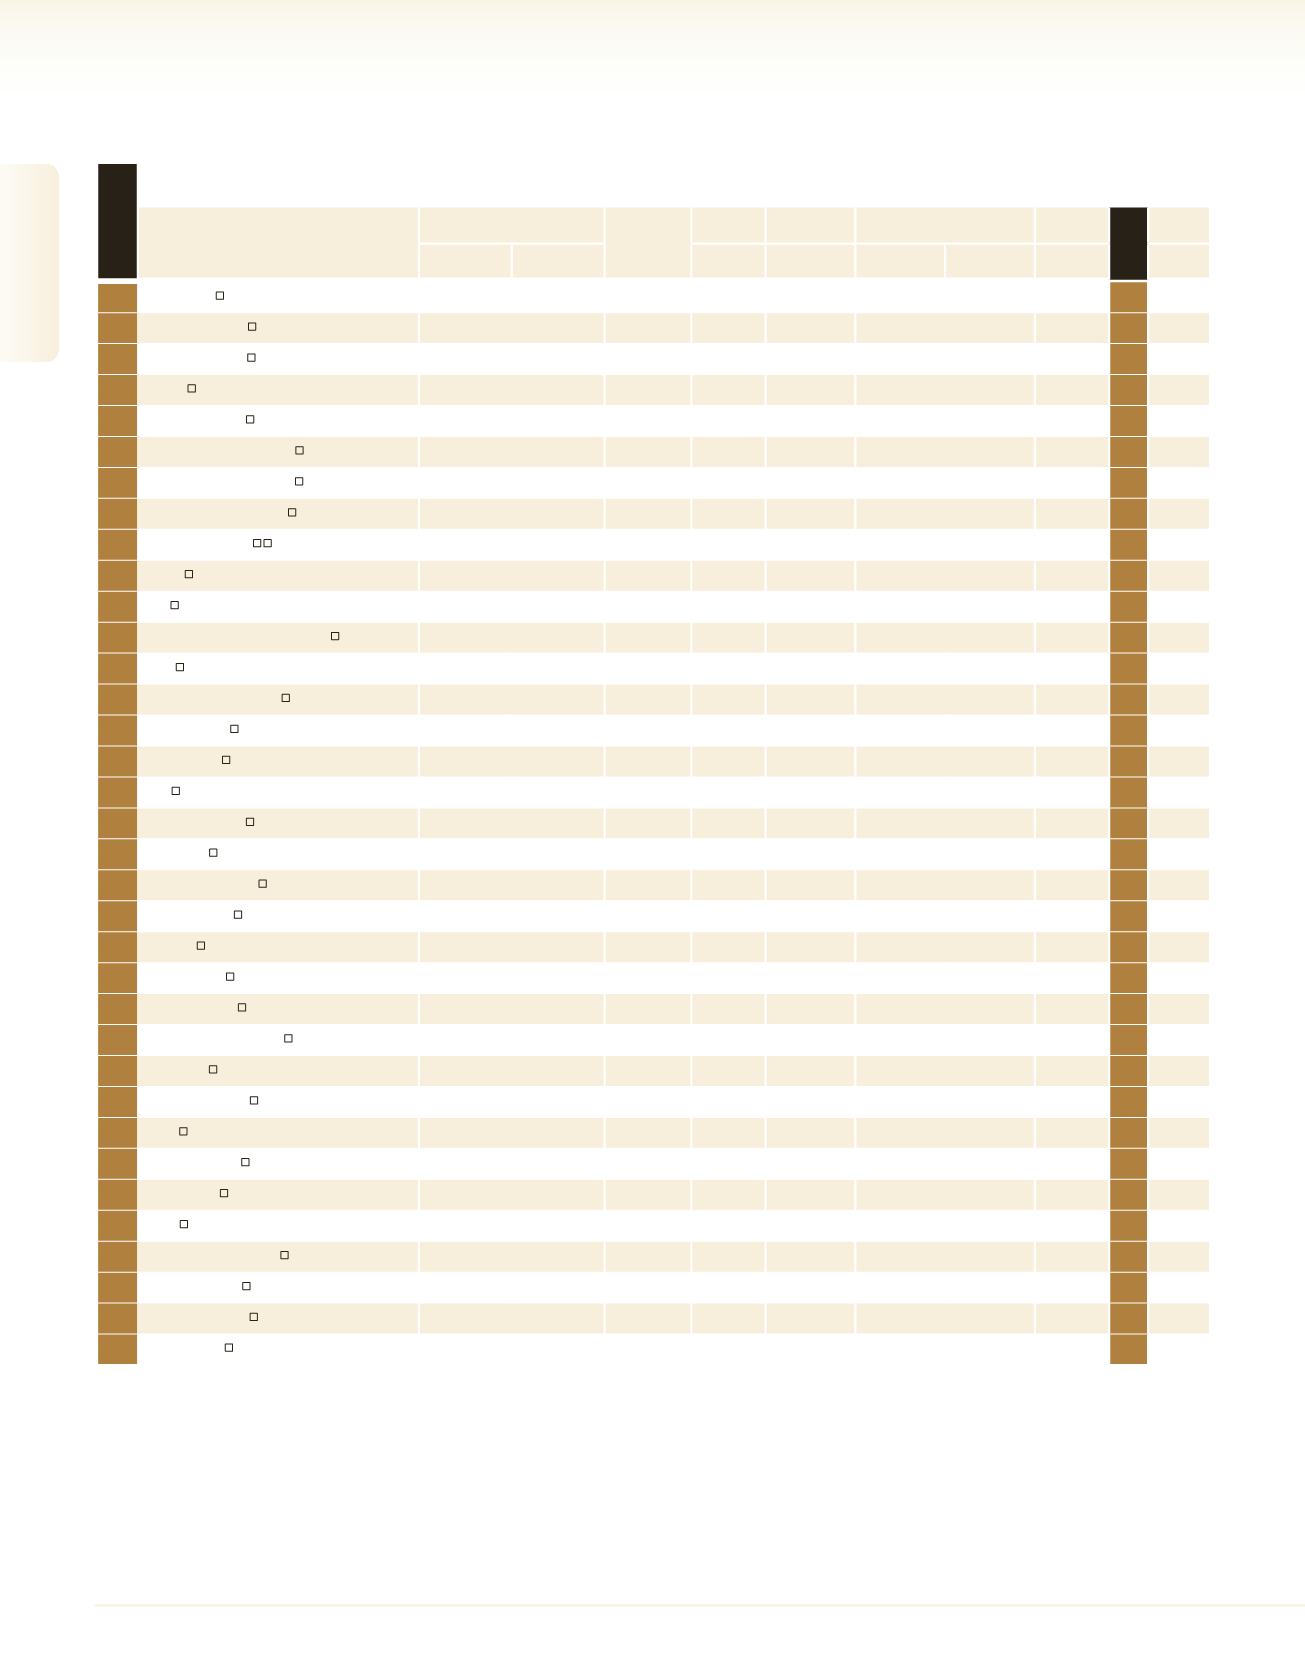
Holding, Management & Investment Companies By Equity
1
Delek Group
4,486.0
-13.8
20
127,023.0
7.0
6,356.0
-18.8
30
2
18
2
Israel Corporation
3,749.8
-47.4
1
42,090.9
1,710.2
21,008.7
-3.9
13
1
3
F.I.B.I. Holding Co.
3,424.0
4.0
5
125,488.0
216.0
3,497.0
-7.2
–
3
4
J.O.E.L.
2,156.3
6.0
3
17,718.2
258.9
2,613.6
2.9
–
5
5
Arad Investments
1,387.5
15.5
4
6,725.6
220.4
2,597.1
9.8
3
8
6
Africa Israel Investments
1
1,318.8
-55.6
34
21,421.8
-1,751.9
5,782.7
-8.7
44
4
20
7
Discount Investment Corp.
1,310.0
6.9
10
36,193.0
72.0
18,110.0
-10.5
28
7
8
Mivtach Shamir Holdings
1,139.7
33.6
2
1,362.4
464.2
24.0
-43.3
7
11
9
B Communications
1,045.0
8.7
6
22,122.0
210.0
9,985.0
10.3
4
9
10
Ekvitel
984.5
9.9
8
17,662.0
145.8
2,613.2
2.9
–
10
11
Elco
719.6
-7.6
13
7,714.9
40.4
7,580.4
13.3
15
12
12
The Israel Land Development Co.
705.7
-4.4
11
4,145.7
64.4
747.4
5.7
–
13
13
Elron
617.3
1.8
19
838.4
9.5
165.5
-73.9
–
15
14
Export Investment Corp.
503.8
5.4
14
14,230.9
27.1
436.4
-2.3
12
16
15
Kerur Holdings
441.4
7.2
9
754.8
87.0
913.0
-0.2
14
18
16
Kardan Israel
419.7
-0.2
16
1,463.0
25.2
558.3
-40.4
22
17
17
I.E.S
369.3
1.2
17
500.5
23.8
64.9
-13.1
5
19
18
Knafaim Holdings
361.9
90.7
7
8,086.2
169.5
8,219.3
7.3
8
22
19
Zur Shamir
319.8
-12.3
12
8,951.4
45.4
2,214.5
9.9
10
20
20
Emilia Development
199.3
-3.8
23
382.3
0.2
249.4
-7.3
3
21
21
Elezra Holdings
188.3
35.7
15
12,885.4
25.5
4,239.8
3.4
2
27
22
Tiv Taam
164.2
12.9
18
595.8
22.1
1,289.9
9.2
17
25
23
Arko Holdings
162.3
6.9
22
1,618.1
3.7
6,754.5
6.9
4
23
24
Leader Holdings
140.3
-4.1
21
434.2
5.6
128.7
3.0
8
24
25
Hamashbir 365 Holdings
131.6
27.2
27
1,034.9
-4.3
2,368.0
0.3
12
31
22
26
Netz Group
117.4
-17.9
33
1,288.1
-58.0
42.7
-0.2
6
26
27
Eldav Investments
113.1
-11.2
29
223.2
-8.0
115.0
133.5
3
28
28
Teuza
104.6
0.1
24
112.6
-2.9
2.4
567.6
–
30
29
Ybox Real Estate
102.5
-5.4
26
103.1
-4.0
–
–
6
29
30
Vision Sigma
86.0
-15.6
31
165.2
-14.0
-2.0
-108.2
9
32
31
Tedea
77.0
-19.4
30
156.2
-13.0
69.7
2.9
3
33
*
Rapac Communications
73.4
-59.3
*
371.3
-104.0
181.6
-2.6
7
*
32
B. Gaon Holdings
48.3
1.8
25
574.7
-4.0
393.7
-4.1
5
35
33
Dolomite Holdings
23.3
-43.5
28
37.1
-6.5
1.8
-57.1
3
36
34
Inter-Gamma
18.0
-79.0
32
871.8
-49.5
573.4
11.1
3
34
1
- The company has a going concern notice in its audited financial reports for 2015.
Company
Equity
Secondary
Rank
2016 by Net
Profit
Balance
Net Profit
Revenues
Employees
Rank 2015
Profile
NIS
Millions
Change
(%)
NIS
Millions
NIS
Millions
NIS
Millions
Change
(%)
Number
See
Page
rank 2016
14
2016
|
DUN’S
100
DUN’S
100
|
2016
DUN’S
100
|
2016
2016
|
DUN’S
100