


 9 / 730

credit days, to 119 days. The long collection
periods and the general payment ethics are a
major problem, especially for small and medium
enterprises, since the determination of the com-
mercial terms is made by the parties with the
stronger bargaining position. It is estimated that
a reduction of one day of the credit days would
save the economy c. NIS 150 million. This could
enable businesses to focus on development and
investment and such a step could be considered
to be a significant economic growth driver.
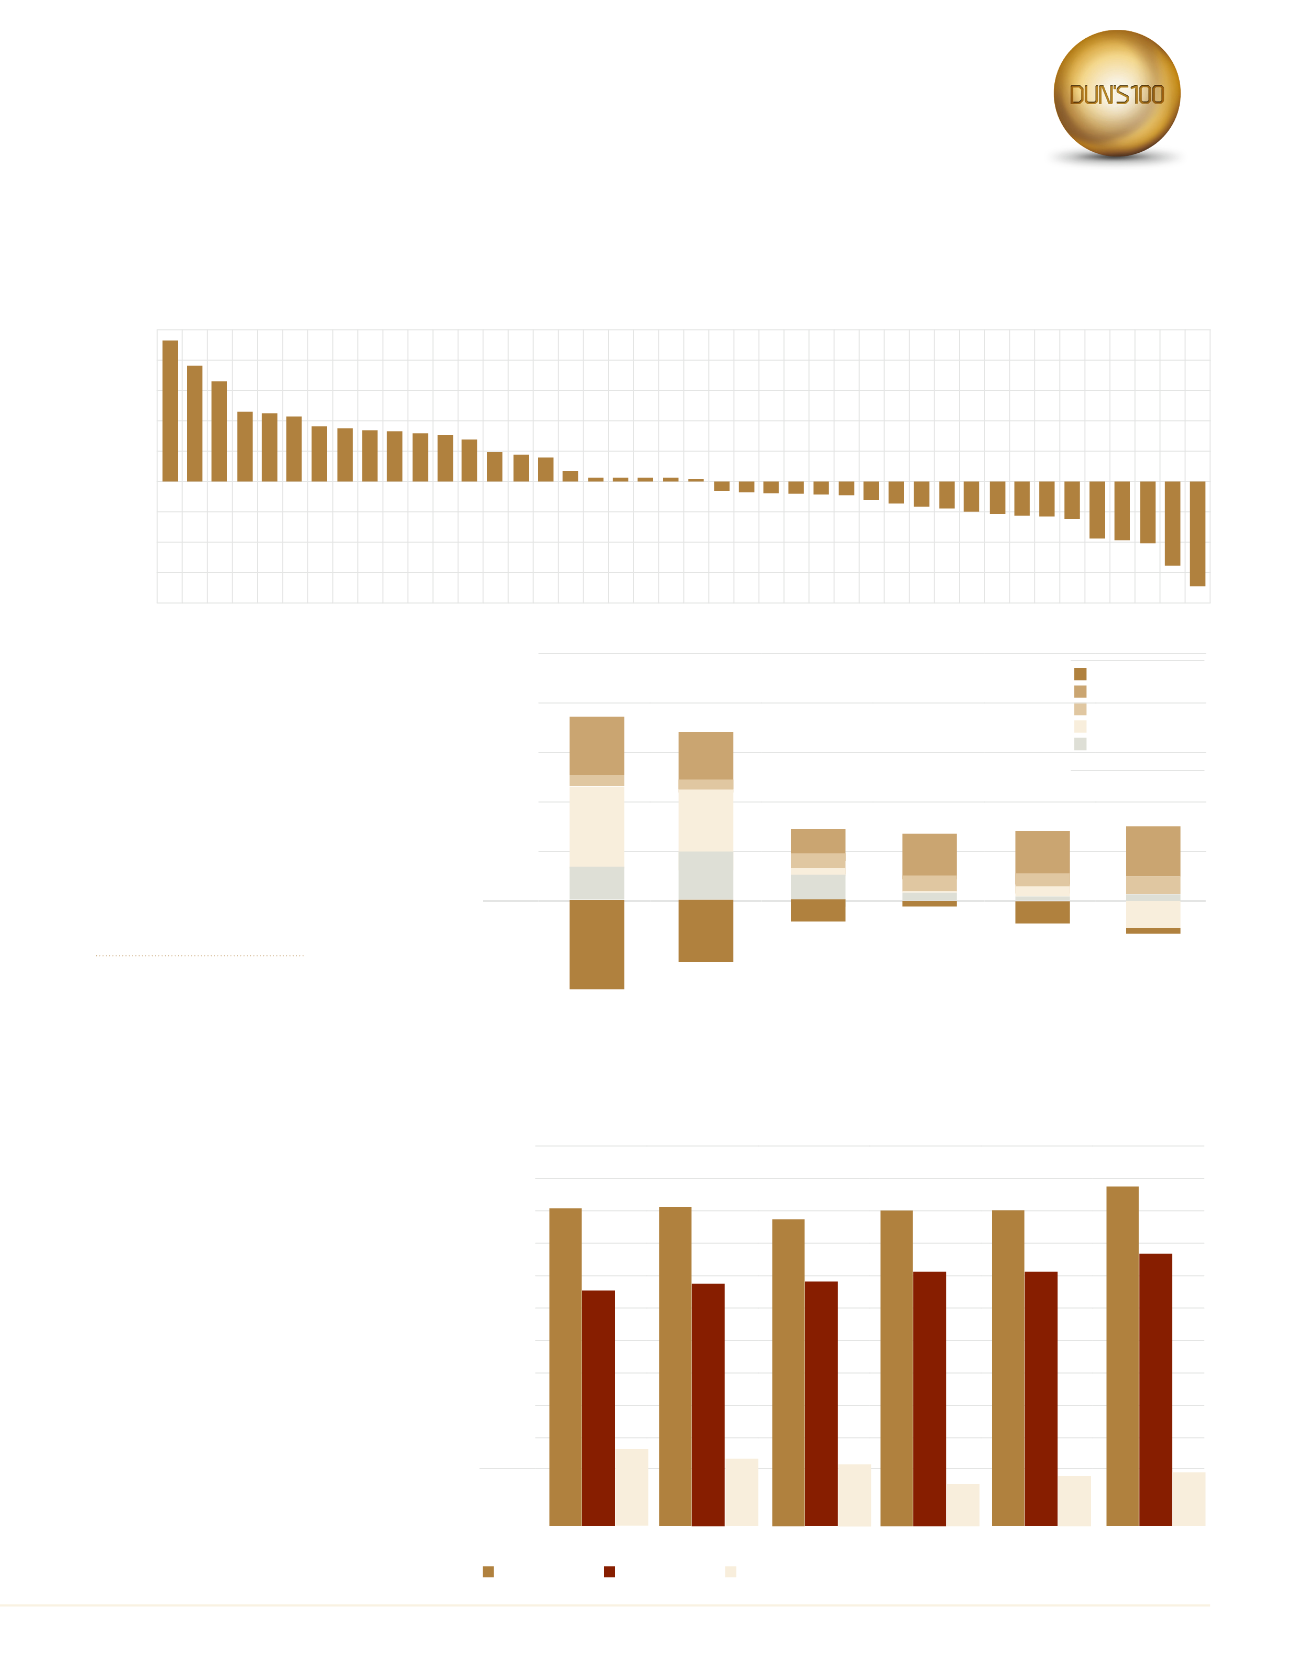
The composition of growth
A review of the composition of growth shows
that this isn’t a sustainably healthy growth. The
GDP is affected by import, export, investment,
private consumption and public spending. The
following chart shows the contribution of each of
the GDP’s components to its growth. We can see
that the Israeli economy relied on exports as a
growth driver until 2011, but in recent years, the
main growth driver is private consumption, with
no growth in export and even a decline in 2015.
In recent years, the government supported the
private consumption as a growth driver for the
economy, through the provision of credit to the
households, but most of the consumption of the
households was allocated to mortgages, which
don’t contribute to the growth of the economy.
Pharmaceutical Industries
Cosmetics Industries
Paper & Cardboard industries
Plastic & Rubber Industries
Chemical Industries
Engineering & Architecture
Software Houses
Food Industries
Communications Equipment
Electronic Components Industry
Leasing
Communication
Travel Agencies
Auto-Body Shops
Hotels & Guesthouses
Construction Inputs
Import & Trade of Food Items
Textile Industry
Furniture Industry
Transportation Services
Salons & Beauty Parlors
Advertising & PR
Stationery & Office Supplies
Industrial Laundromats
Computers & Peripherals
Printing Industries
Hardware Stores
Pharmacies
Metal Industries
Construction
Optical Shops
Fashion & Clothing Stores
Nursery
Electrical & Electronics
Companies
Transportation & Storage
Services
Fuel Trading
Agriculture
Furniture Stores
Toy Stores
Flower Shops
Wholesale Food
Cafes & Restaurants
50%
40%
30%
20%
10%
0%
-10%
-20%
-30%
-40%
Source: D&B
Secrtor's Risk Level
Market Sectors' Risk Levels In comparison to the Average Market Risk Level
55000
50000
45000
40000
35000
30000
25000
20000
15000
10000
5000
0
2015
2014
2013
2012
2011
2010
Added Businesses Business Closings Business Opennings Source: D&B
37845
50362
12487
38442
50602
12160
39022
49107
10085
41518
50185
8667
42159
51502
9343
44500
54000
9500
Import
Private Consumption
Public Consumption
Export
Investments
10.0%
7.5%
5.0%
2.5%
0.0%
-2.5%
-5.0%
2015
2014
2013
2012
2011
2010
Source: D&B
9
2016
|
DUN’S
100
DUN’S
100
|
2016
DUN’S
100
|
2016
2016
|
DUN’S
100