


 8 / 730

I
n 2015, the most prominent factors in the
global economy were the geo-political
processes in China and in the Middle East.
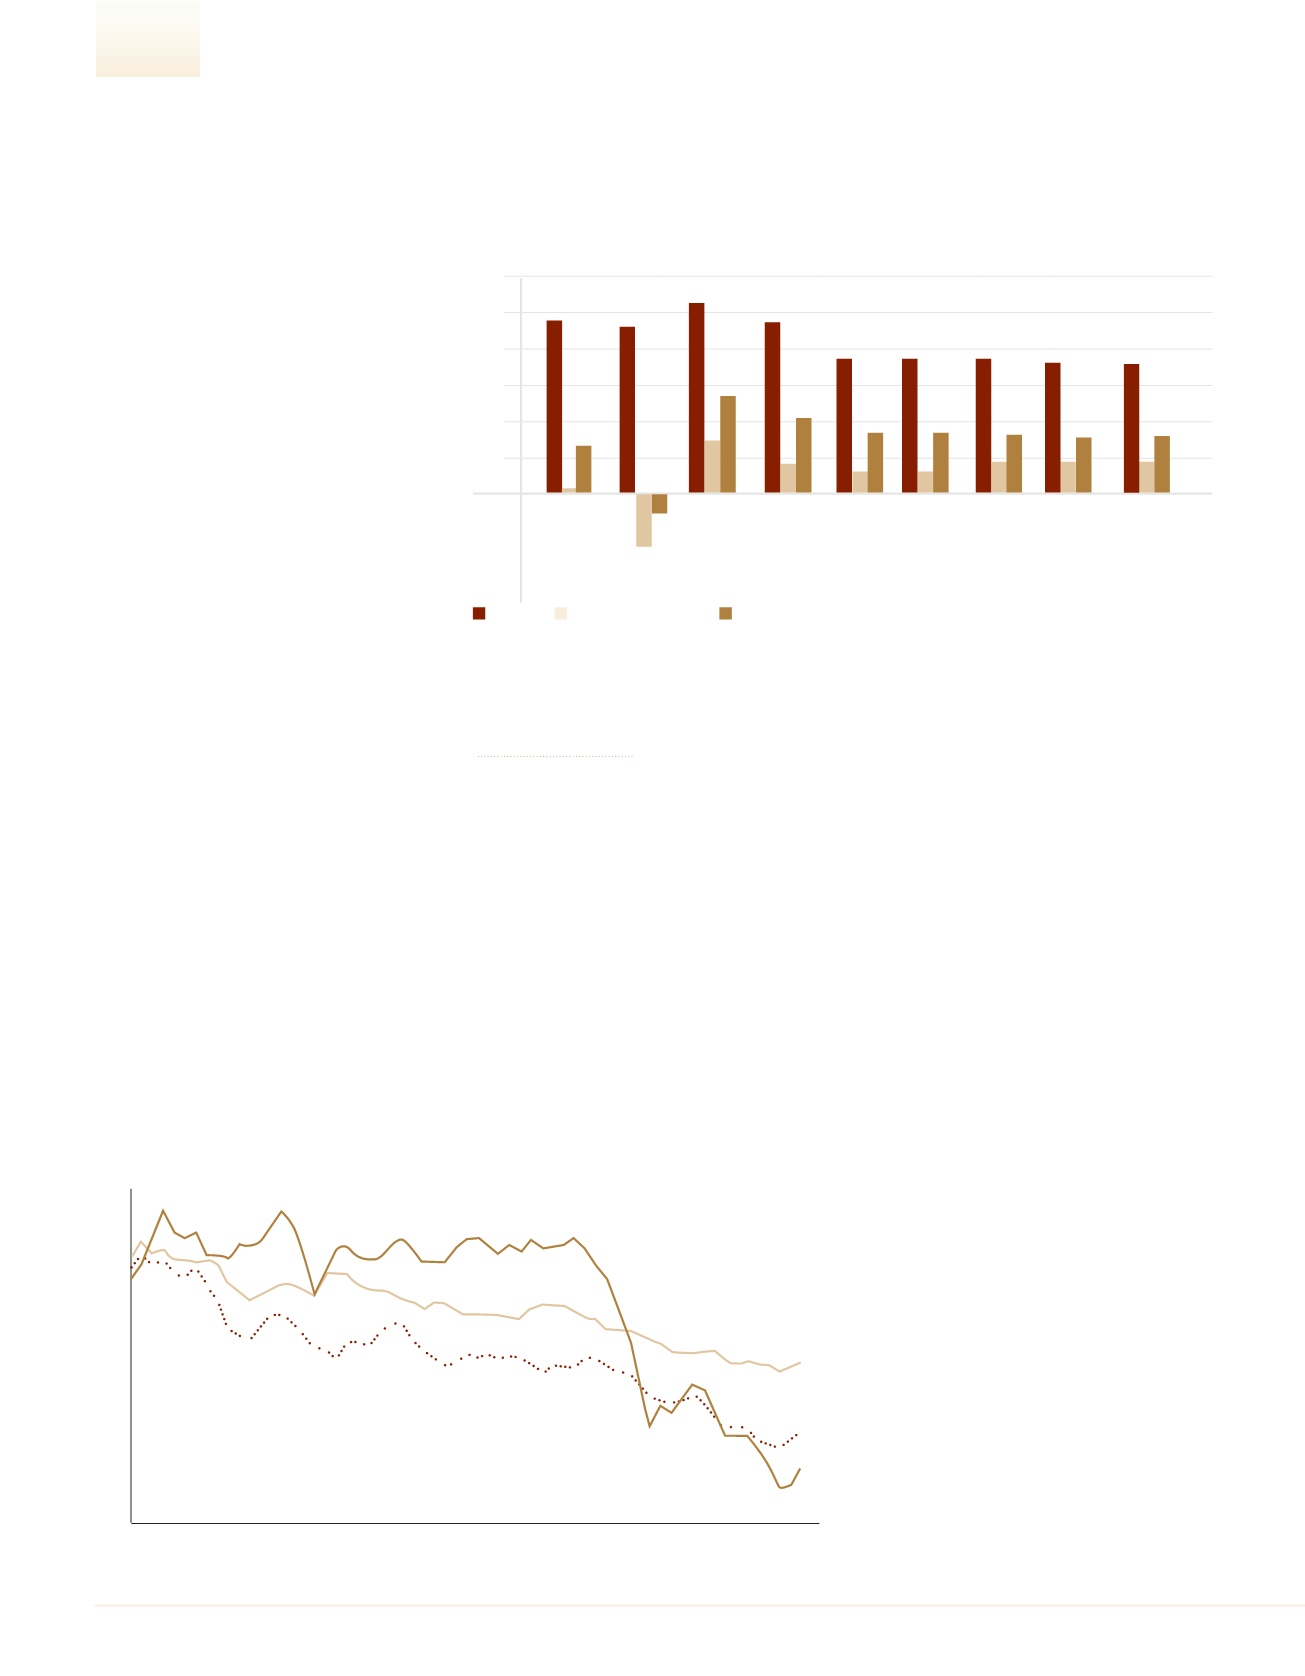
China – the growth driver of the global economy
– has displayed a decline in its GDP growth rate
since 2010, mainly due to a trend of increasing
production costs in China and a decline in the
prices of commodities. The zero interest rate
policy led to a huge increase of global debts.
The world currently owes almost three times as
much as it produces, with the debt amounting to
c. $220 trillion. The main concern is that when
the interest rates will rise, several debt niches
would find it difficult to serve their debts, for
example the debts in China’s corporate and
household sectors. Since November 2014, the
central bank of China made 6 interest rate cuts
in order to increase consumption and invest-
ments and mainly in order to encourage China’s
middle class to transfer funds into the capital
markets, with the unstated goal being – to in-
crease the extent of raised bonds, in order to
enable Chinese companies to make extensive
investments around the globe. In the past three
years, we saw an increase in the contribution of
the developed countries to the global growth,
and a decline in the contribution of the devel-
oping countries to the global growth, mainly
because of China, which leads the developing
countries and currently produces c. 15% of the
global GDP.
The slowdown in China’s economic growth rate
and the surplus supply in Saudi Arabia’s oil pro-
duction led to a decline of commodity prices,
a matter which greatly affects the developing
countries, where there is a high share of com-
modities in the national income.
The Israeli economy
Israel’s economy is changing – and becoming
more commerce- and services-oriented and
less industrial. In 2015, the number of newly
opened businesses increased by c. 6%, a good
increase in comparison to stagnation in the
previous five years. However, the number of
closed businesses showed a similar increase,
so that the net increase was similar to its level
in the previous year. In 2016, we expect that
the number of newly opened businesses will
continue to increase and we estimate that it
would amount to 57,240 businesses.
We estimate that the number of closed busi-
nesses will show a sharper increase and would
amount to 48,861, so that the overall net in-
crease of businesses in this year will be 8,379
businesses, c. 12% less than in the previous
year. The main reason for the decline in the
net increase of businesses in 2016 is that the
current mix of businesses includes more busi-
nesses in the commerce sectors, which are
more risky in comparison to other sectors. So
it’s true that the number of newly opened busi-
nesses increased, but what type of businesses
were added to the economy? Mainly service
providers. The industrial and agricultural sec-
tors are fading, with a negative net increase
that continues the trend of the last three years.
Service providers constitute about 65% of the
businesses in the economy, but they only they
generate only c. 30% of the income and there-
fore we will not feel this increase significantly
in the GDP.
In 2015 the economy indeed recorded posi-
tive macro-economic data, an annual growth
rate of 2.5%. Nevertheless, the situation of the
businesses in this year deteriorated. The main
reason for this discrepancy was margin erosion
across almost every industry of the economy.
Businesses find it harder to achieve income
growth, to maintain profitability and to finance
their working capital needs. The margin ero-
sion, along with an increase in the leverage,
leads to an increase of the risk level. So that the
risk level of one third of the active businesses
increased during the last year. It is difficult to
develop a business when the managerial inputs
are dedicated to financing working capital and
debt collection. The trend of increasing average
collection period (“credit days”) continued in
2015, with an increase of c. 2.5% in the average
The Israeli and the global economies in 2015
And a forecast for 2016
10
8
6
4
2
0
-2
-4
China Advanced Economics World
0.2
-3.1
-0.1
2012
2010
2013
2015
2011
2014
2016
9.2%
10.6%
9.5%
1.7%
1.2%
1.2%
1.8%
1.9%
1.9%
4.2%
7.7%
7.7%
7.7%
6.9%
6.5%
3.3%
3.1%
3.5%
3.3%
3.4%
3.1%
3.2%
5.2%
2009
9.6%
2008
China Convenes to a More Moderated Growth
The Decline in Commodity Prices Damages Growth Predictions
Jan 15
Jan 16
Mar 14
May 13
May 15
May 16
Jul 12
Sep 11
Nov 14
Jan 14
Mar 13
Mar 15
Mar 16
May 12
Jul 11
Sep 14
Nov 13
Nov 15
Nov 16
Jan 13
Mar 12
May 11
Jul 14
Sep 13
Sep 15
Sep 16
Nov 12
Jan 12
Mar 11
May 14
Jul 13
Jul 15
Jul 16
Sep 12
Nov 11
Jan 11
US% indexes, 100=2010
150
130
110
90
70
50
30
8
2016
|
DUN’S
100
DUN’S
100
|
2016
DUN’S
100
|
2016
2016
|
DUN’S
100