


 549 / 730

A subsidiary of a ranked company |
Company shares are traded in Israel |
Company shares are traded abroad |
Estimated figures
Company
Sales
Exports/Overseas Sales
Net Profit
Equity
Employees
Parent Company
MAIN
RANK
2016
Industry
Profile
NIS
Millions
Change
(%)
NIS
Millions
Change
(%)
% of Total
Sales
NIS
Millions
Profitability
(%)
NIS
Millions
No.
Sales per
Employee
NIS (000)
See
Page
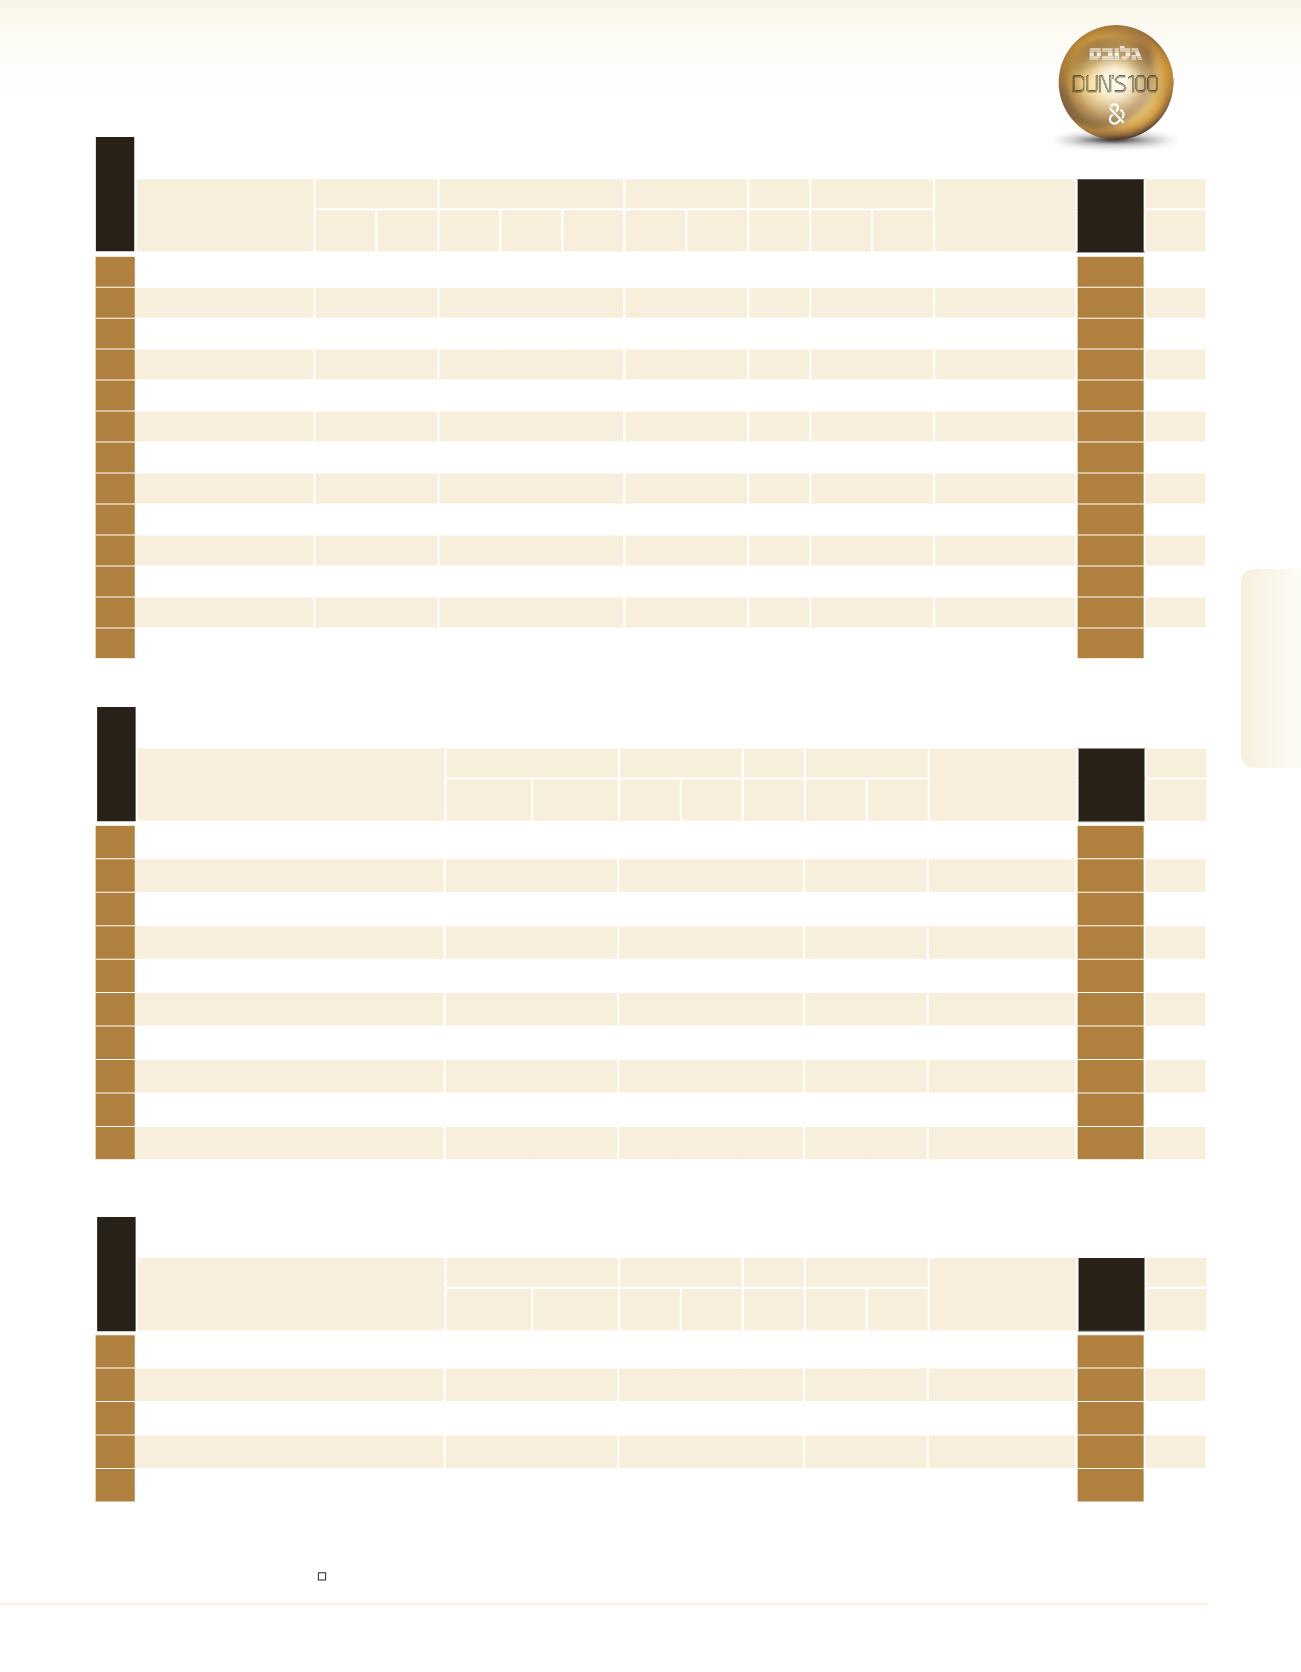
Largest in Pharmaceuticals & Cosmetics
1
Teva Pharmaceutical
Industries
76,385.4
5.3 73,636.0
5.4
96.4
6,114.1
8.0 116,158.6 42,888 1,781.0
–
1
550
2
Taro
3,354.2
23.5
3,322.5
24.0
99.1
1,882.3 56.1
5,530.6 1,339 2,505.0
–
25
3
Perrigo Israel
1,780.0
5.3
1,483.0
5.2
83.3
– –
–
1,200 1,483.3
Perrigo Company
46
551
4
Dexcel Pharma
900.0
–
– – –
– –
–
895 1,005.6
Dexcel PT Israel
86
5
Omrix Biopharmaceuticals
615.6
55.3
– – –
– –
–
495 1,243.7
Johnson & Johnson
118
6
L’Oreal
487.0
-1.0
– – –
– –
–
1,105
440.7
L’Oreal S.A.
137
552
7
Tropical Degil Cosmetic
Industries
320.0
-7.0
67.0 -21.6
20.9
– –
–
265 1,207.5
–
191
8
Dr. Fischer
300.0
–
– – –
– –
–
740
405.4
Fischer Pharmaceutical
Laboratories
197
9
Henkel Soad
290.0
–
– – –
– –
–
65 4,461.5
Henkel KGaa
202
10
Kamada
271.7
6.9
– – –
-43.8 -16.1
282.9
319
851.8
–
209
11
Rekah
262.4
-2.8
– – –
-4.4 -1.7
123.0
594
441.8
–
215
12
Emilia
226.5
-5.0
101.2
11.5
44.7
– –
19.4
383
591.4
Emilia Development (O.F.G)
228
13
Enzymotec
195.9
16.2
190.7
16.9
97.4
26.0 13.3
533.5
195 1,004.4
–
244
rank 2016
Wholesale Medical Equipment And Medicines
1
Neopharm
1,550.0
2.0
– –
–
700 2,214.3
–
28
2
SAREL
1,180.0
13.1
– –
–
144 8,194.4
Society of Public Hospitals
for the Public
34
553
3
Chemipal
789.4
7.9
– –
33.3
545 1,448.4
–
58
554
4
Medison Pharma
558.0
10.6
– –
–
180 3,100.0
Medison Biotech
75
5
Ilex Medical
497.5
14.9
31.1
6.3
119.7
281 1,770.4
–
84
6
A. Lapidot Pharmaceuticals
458.0
36.4
– –
–
230 1,991.3
–
91
7
Pfizer Pharmaceuticals Israel
380.0
–
– –
–
135 2,814.8
Pfizer Inc
104
8
Medtechnica
260.6
19.4
12.4
4.8
175.4
140 1,861.5
Ilex Medical
*
9
Agentek (1987)
164.0
2.5
– –
–
100 1,640.0
A.V.L.Y.K. Investment
165
10
Levant Technologies
128.0
6.7
– –
39.0
60 2,133.3
Hirshberg Bros
179
555
Cosmetics And Toiletries
1
Super-Pharm
4,480.0
5.2
– –
–
7,800
574.4
–
5
2
New-Pharm
697.0
–
– –
–
1,133
615.2
Hamashbir 365 Holdings
63
3
Elcalil
324.4
10.7
– –
–
850
381.7
Estee Lauder
114
556
4
Alpa-Cosmetics
196.0
–
– –
67.8
627
312.6
Yaakov & Vera Brand Assets
156
5
April
136.6
-1.5
– –
–
212
644.2
Jacques Bogart International
BV
176
Company
Revenues
Net Profit
Equity
Employees
Parent Company
Main
Rank
2016
Trade
Profile
NIS
Millions
Change
(%)
NIS
Millions
Profitability
(%)
NIS
Millions
No.
Rev. per
Employee
NIS (000)
See
Page
Company
Revenues
Net Profit
Equity
Employees
Parent Company
Main
Rank
2016
Trade
Profile
NIS
Millions
Change
(%)
NIS
Millions
Profitability
(%)
NIS
Millions
No.
Rev. per
Employee
NIS (000)
See
Page
rank 2016
rank 2016
Medical Equipment / Cosmetics
549
2016
|
DUN’S
100
DUN’S
100
|
2016
DUN’S
100
|
2016
2016
|
DUN’S
100
Medical Equipment /
Cosmetics
15.5mm
גודלמינימלי ללוגו