


 68 / 730

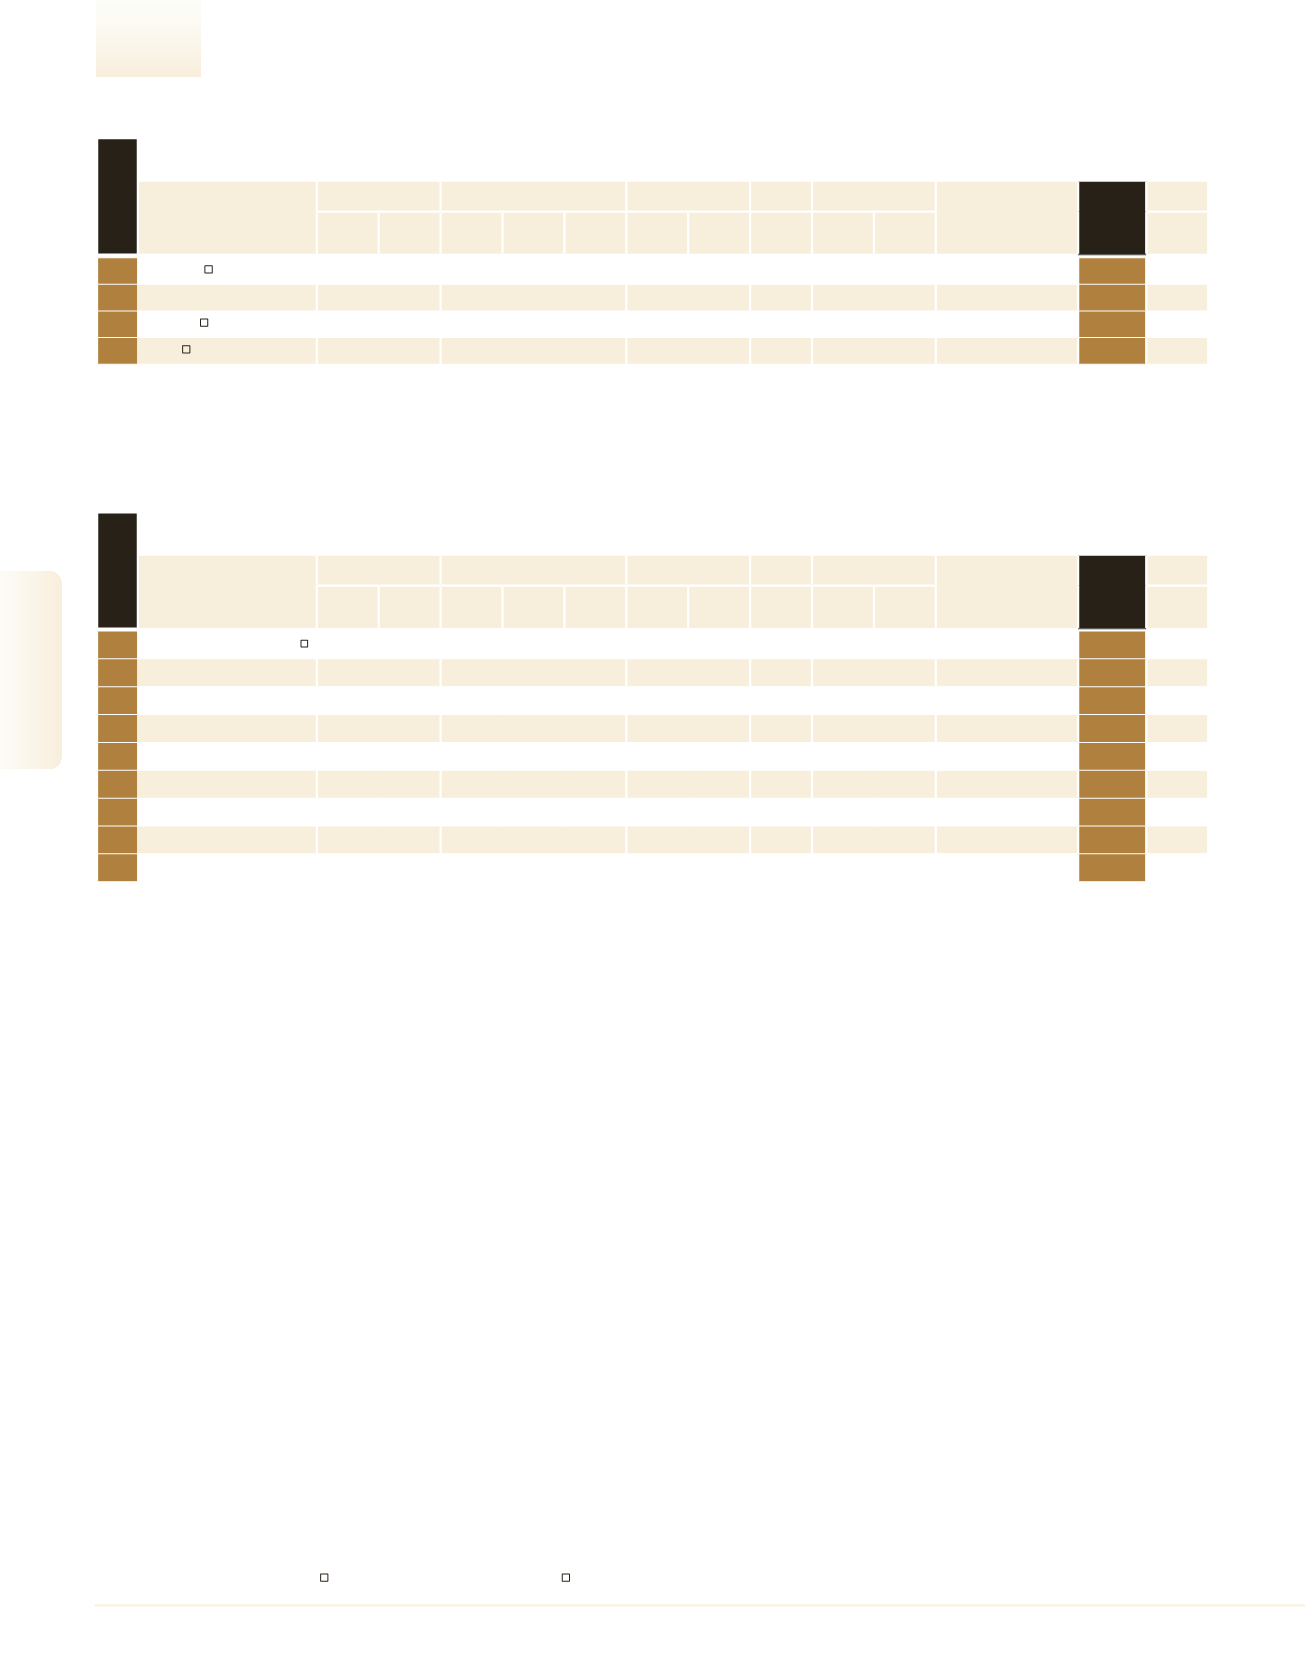
A subsidiary of a ranked company |
Company shares are traded in Israel |
Company shares are traded abroad |
Estimated figures
Industrial Companies Ranking
Largest in Textile & Fashion
1
Delta Galil
4,197.8
13.7
3,708.8
14.6
88.4
170.4
4.1
1,390.5 8,750
479.7
–
19
2
Nilit
1,676.4
-5.6
1,663.2
-5.4
99.2
– –
–
1,484 1,129.6
Nilit B.V.
49
3
Spuntech
530.0
3.5
522.2
5.6
98.5
77.0 14.5
153.6
318 1,666.5
Nissan Medical Industries
127
4
Tefron
361.8
7.7
358.1
7.3
99.0
-15.3 -4.2
110.5
856
422.7
–
172
Company
Sales
Exports/Overseas Sales
Net Profit
Equity
Employees
Parent Company
MAIN
RANK
2016
Industry
Profile
NIS
Millions
Change
(%)
NIS
Millions
Change
(%)
% of Total
Sales
NIS
Millions
Profitability
(%)
NIS
Millions
No.
Sales per
Employee
NIS (000)
See
Page
rank 2016
Largest in Agricultural Inputs
1
ADAMA Agricultural Solutions
11,909.0
3.3 11,542.3
3.5
96.9
428.0
3.6
6,113.0 4,864 2,448.4
–
10
2
Ambar
2,039.1
-4.9
– – –
– –
694.2
330 6,179.2
–
37
3
Miloubar
1,271.4
2.8
– – –
– –
77.3
100 12,714.4
Milouot Bay Settlement
Development Co.
64
4
Hazera Seeds
709.8
3.4
621.4
3.9
87.6
– –
533.3
792
896.2
Vilmorin & Cie
110
5
Tadmir Group Management &
Operating (2006)
675.2
4.4
– – –
– –
–
94 7,183.0
G.R.Artzi Consulting &
Management
114
6
Zemach Feed Mill
399.2
-9.5
– – –
– –
– –
– –
156
7
Hishtil
390.0
–
– – –
– –
–
450
866.7
–
161
8
Deshen Gat
260.0
17.9
195.0
30.0
75.0
– –
48.0
90 2,888.9
Federman & Sons (Holdings)
216
9
Zeraim Gedera
200.0
-8.9
160.0
-6.4
80.0
– –
160.0
180 1,111.1
Syngenta Agroservice AG
243
Company
Sales
Exports/Overseas Sales
Net Profit
Equity
Employees
Parent Company
MAIN
RANK
2016
Industry
Profile
NIS
Millions
Change
(%)
NIS
Millions
Change
(%)
% of Total
Sales
NIS
Millions
Profitability
(%)
NIS
Millions
No.
Sales per
Employee
NIS (000)
See
Page
rank 2016
68
2016
|
DUN’S
100
DUN’S
100
|
2016
DUN’S
100
|
2016
2016
|
DUN’S
100
Industrial Companies