


 66 / 730

A subsidiary of a ranked company |
Company shares are traded in Israel |
Company shares are traded abroad |
Estimated figures
Industrial Companies Ranking
Metal Products
X
X
Company
Sales
Exports/Overseas Sales
Net Profit
Equity
Employees
Parent Company
MAIN
RANK
2016
Industry
Profile
NIS
Millions
Change
(%)
NIS
Millions
Change
(%)
% of Total
Sales
NIS
Millions
Profitability
(%)
NIS
Millions
No.
Sales per
Employee
NIS (000)
See
Page
rank 2016
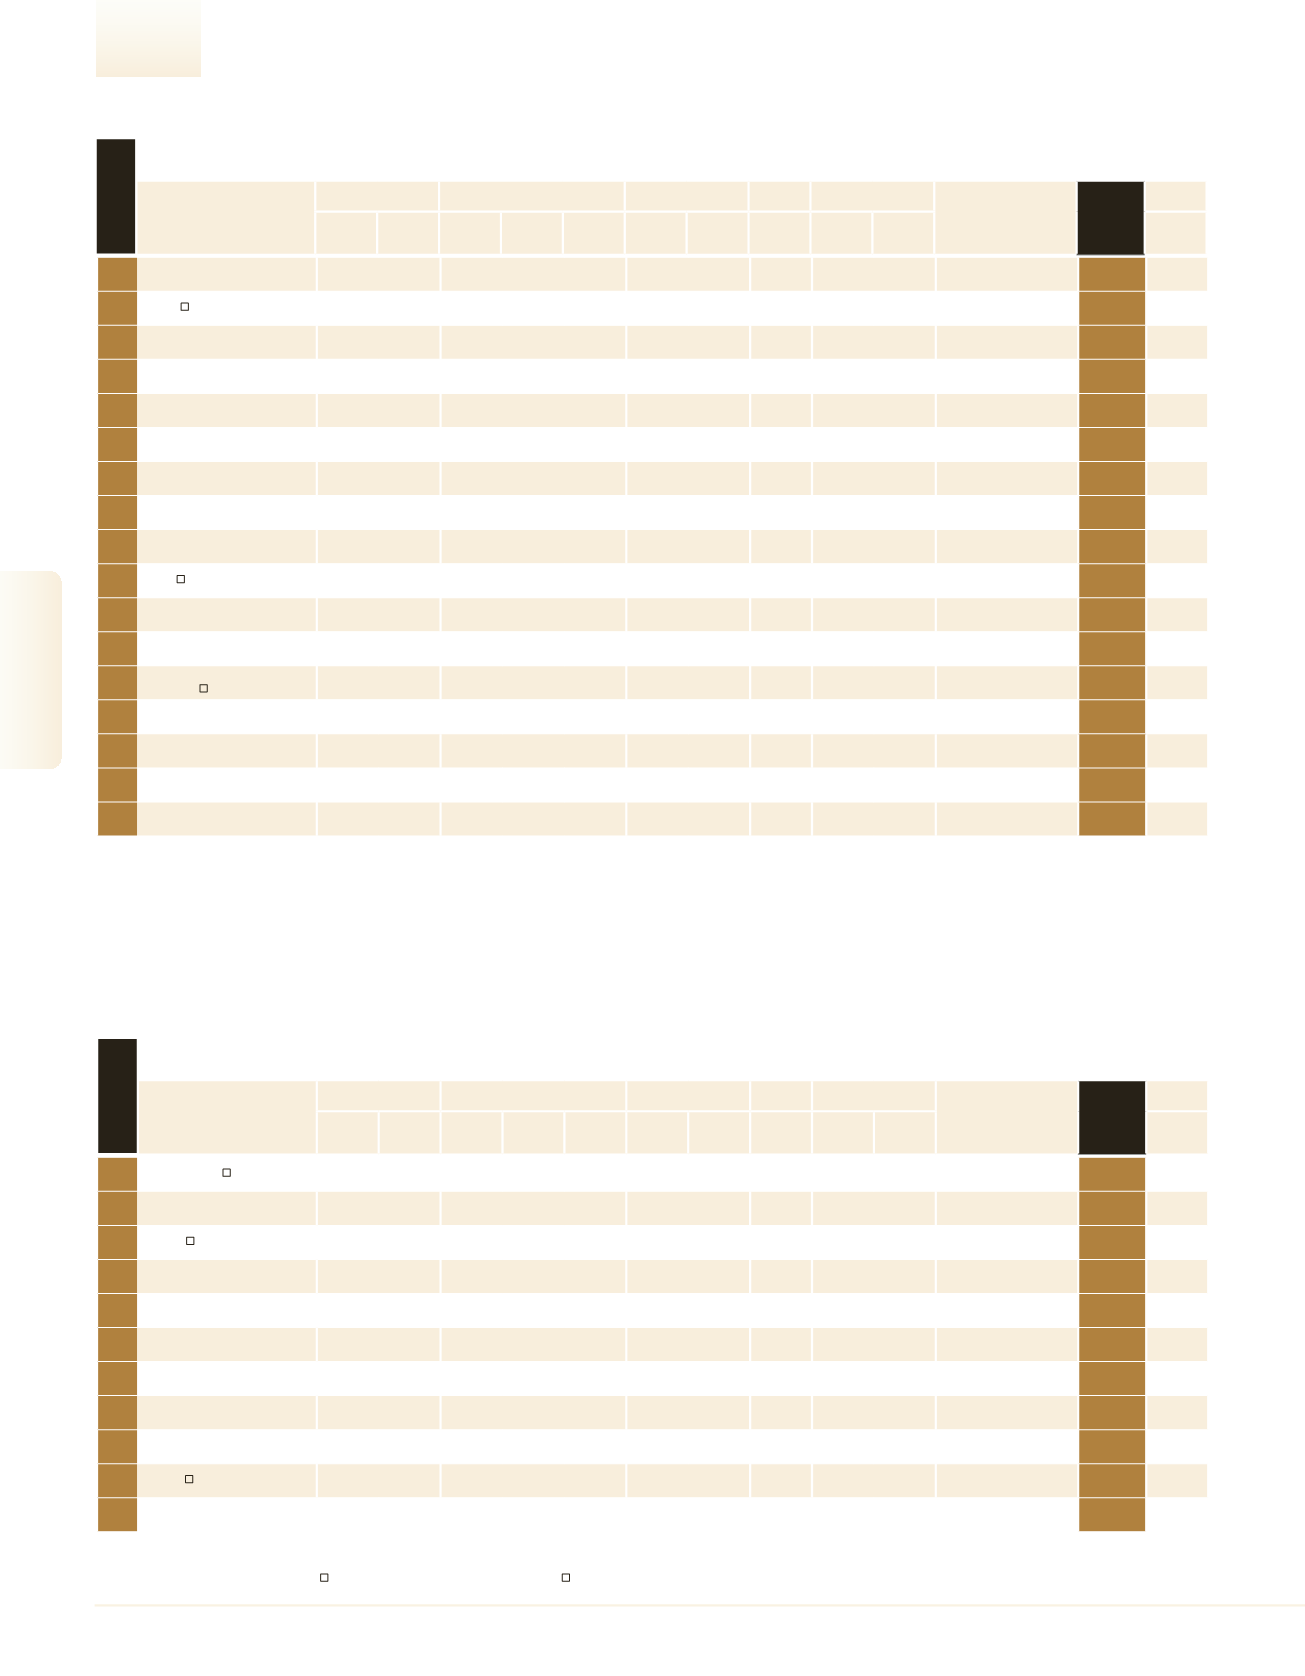
24
Merkavim
263.5
-21.2
– – –
– –
–
643
409.8
Mayer’s Cars & Trucks
214
25
Brand
227.6
-7.0
65.9 1,842.7
28.9
0.8
0.4
66.7
375
607.0
KCPS Energy Industries
227
26
Camel Sarid
225.0
–
– – –
– –
–
230
978.3
Kibbutz Sarid
230
27
Extal
220.0
–
– – –
– –
–
290
758.6
–
232
28
Carmel Forge
201.0
2.9
182.6
1.6
90.9
– –
–
199 1,010.1
United Technologies
International Corp.
239
29
SHL - Alubin
200.0
–
– – –
– –
–
245
816.3
–
242
30
Caniel Industries A.T.G
195.0
–
– – –
– –
–
250
780.0
–
246
31
Meptagon
173.6
68.0
– – –
– –
31.1
335
518.2
Harary Sapir Technology
257
77
32
Pachmas
170.0
8.1
22.0
8.2
12.9
– –
30.0
145 1,172.4
Greif
261
33
Avrot
164.2
20.2
13.8
25.5
8.4
8.2
5.0
79.0
219
749.6
–
267
34
Omen High Pressure Die
Casting
151.9
-6.3
150.0
-6.3
98.8
– –
79.4
230
660.3
Omen Holdings
272
35
Palraz Engineering
128.8
11.5
0.2
–
0.1
– –
45.0
234
550.4
–
283
36
Carmor Integrated Vehicle
Solutions
122.4
36.8
65.9 711.5
53.8
7.4
6.1
18.4
102 1,200.2
–
287
37
Modgal Metal (99)
114.4
2.1
67.6
-4.7
59.0
– –
52.0
175
654.0
Crithmun Industries
289
38
Lordan A.C.S
109.5
5.3
94.0
4.4
85.8
– –
29.5
190
576.3
Kfar Sald Holdings A.C.S
293
39
Agam Metal Works
108.0
-1.8
– – –
– –
–
290
372.4
–
295
40
Hazorfim
108.0
1.9
– – –
– –
–
220
490.9
–
296
Largest in Wood & Paper Products
1
Hadera Paper
1,741.4
-0.9
288.1
13.7
16.5
196.5 11.3
980.9 1,682 1,035.3
Clal Industries
47
2
Hogla Kimberly
1,642.2
2.0
377.5
-7.3
23.0
– –
264.1 1,201 1,367.4
Kimberly Clark
51
3
Albaad
1,493.8
3.4
1,396.5
2.5
93.5
40.2
2.7
474.4 1,648
906.4
Moshav Massuot Yitzhak
55
4
Cargal
769.0
-0.9
– – –
– –
–
700 1,098.6
–
103
5
Tadbik
743.1
4.4
400.3
5.4
53.9
17.7
2.4
120.3 1,016
731.4
–
107
6
Carmel Frenkel
475.0
-1.5
150.0
–
31.6
– –
–
530
896.2
Hadera Paper
*
7
I.M.A. 1990
468.3
2.5
0.7 -55.9
0.1
– –
–
330 1,419.1
Mishmar Hamifratz ACS
145
8
Best Carton
300.0
–
– – –
– –
–
200 1,500.0
–
198
9
Makor Haformaika
265.0
–
– – –
– –
–
230 1,152.2
–
213
10
Shaniv
219.1
13.8
4.2 -20.3
1.9
12.1
5.5
88.7
283
774.1
–
233
11
Klir
211.0
–
– – –
– –
–
250
844.0
–
235
Company
Sales
Exports/Overseas Sales
Net Profit
Equity
Employees
Parent Company
MAIN
RANK
2016
Industry
Profile
NIS
Millions
Change
(%)
NIS
Millions
Change
(%)
% of Total
Sales
NIS
Millions
Profitability
(%)
NIS
Millions
No.
Sales per
Employee
NIS (000)
See
Page
rank 2016
66
2016
|
DUN’S
100
DUN’S
100
|
2016
DUN’S
100
|
2016
2016
|
DUN’S
100
Industrial Companies