


 64 / 730

A subsidiary of a ranked company |
Company shares are traded in Israel |
Company shares are traded abroad |
Estimated figures
Industrial Companies Ranking
Company
Sales
Exports/Overseas Sales Net Profit
Equity
Employees
Parent Company
Sector
Rank 2015
Profile
NIS
Millions
Growth
(%)
NIS
Millions
% of
Total
Sales
Change
(%)
NIS
Millions
Profit-
ability
(%)
NIS
Millions
No.
Sales per
Employee
NIS (000)
See
Page
Largest Industrial Companies
X
X
by Sales Volume
rank 2016
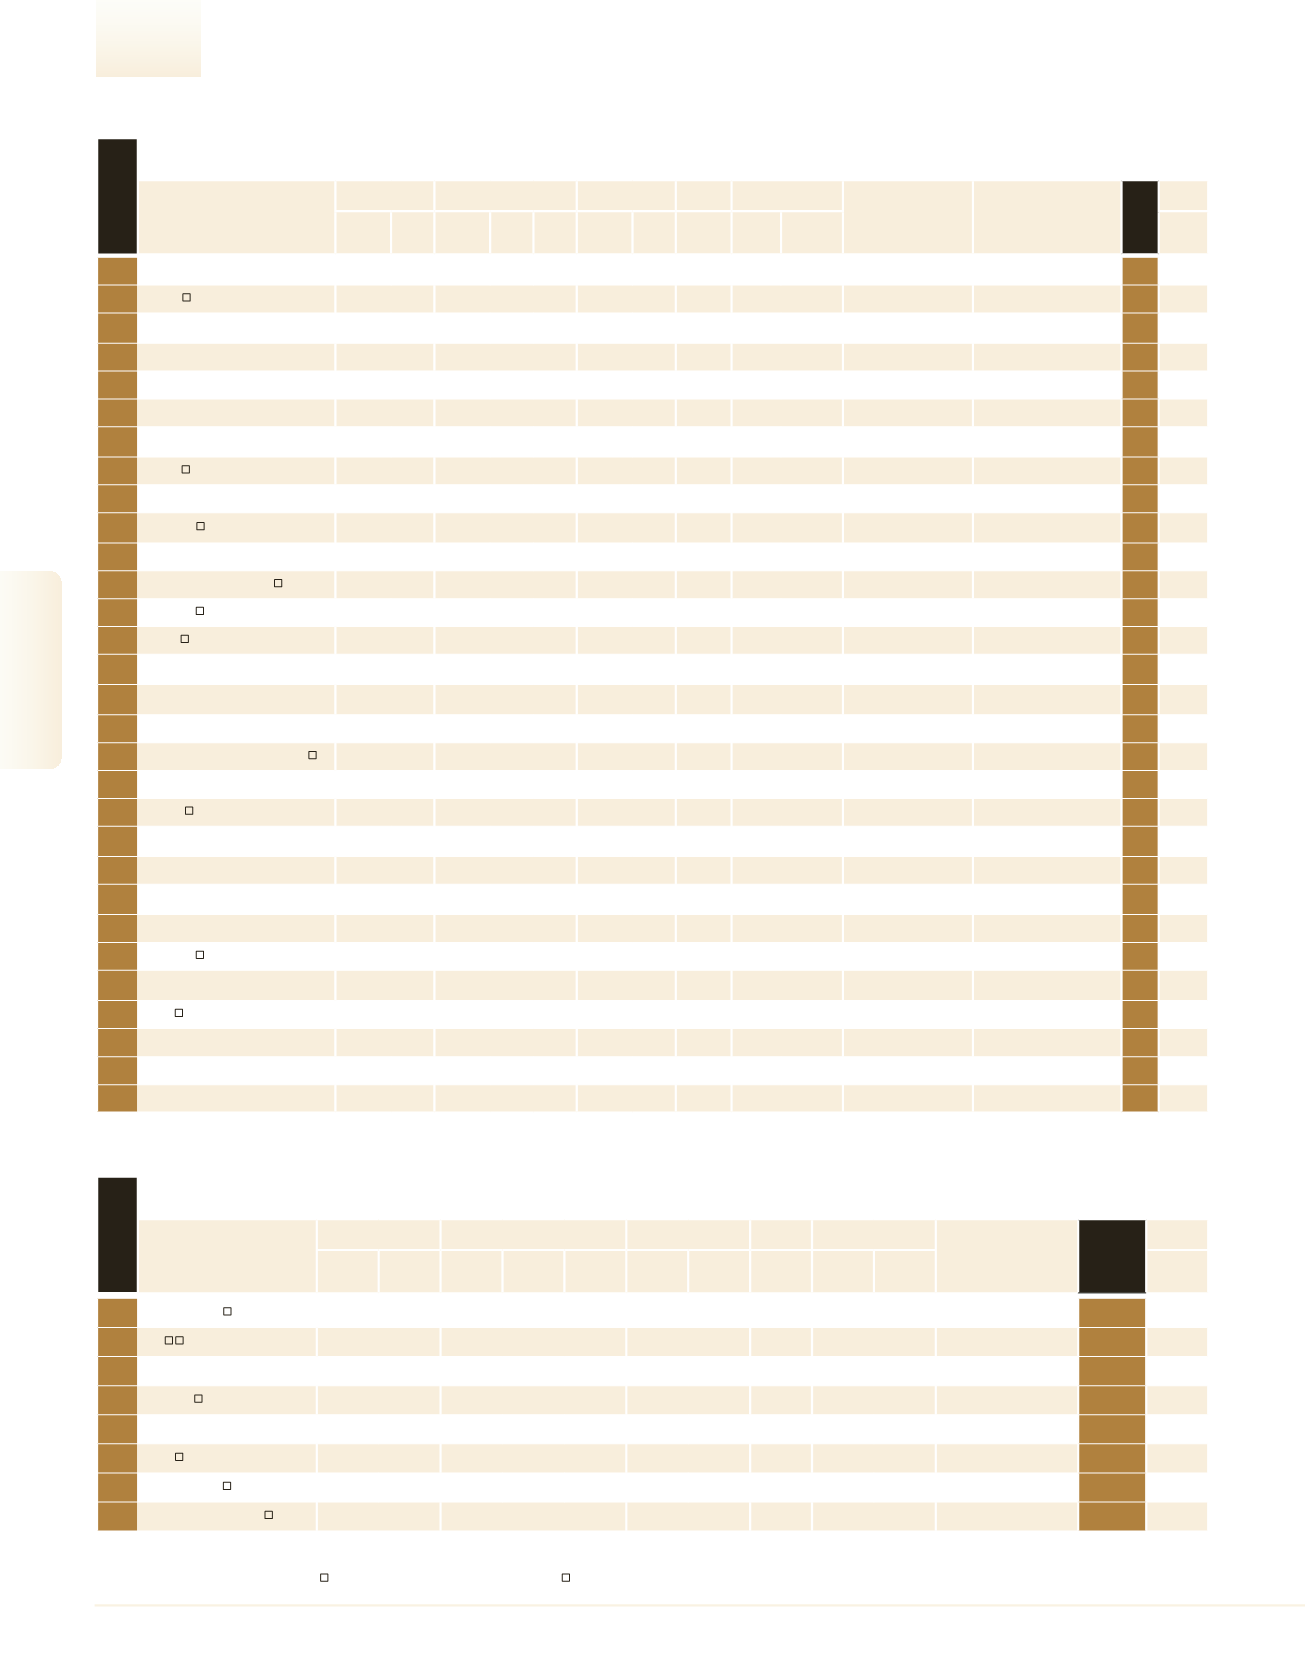
214
Merkavim
263.5
-21.2
– – – – – –
643
409.8
Mayer’s Cars & Trucks
Metal Products
189
215
Rekah
262.4
-2.8
– – –
-4.4 -1.7 123.0 594
441.8
–
Pharmaceutical & Cosmetics
213
216
Deshen Gat
260.0
17.9 195.0 75.0 30.0
– –
48.0
90 2,888.9
Federman & Sons
(Holdings)
Agricultural Inputs
238
217
Palziv Ein Hanatziv
255.0
– – – – – – –
480
531.3
Kibbutz Ein Hanaziv
Plastics , Rubber & Glass
222
218
Tuttnauer
252.6
7.0 225.4 89.2 6.8
– –
152.2 350
721.9
Tuttnauer Holdings
Medical Equipment
235
219
Wissotsky Tea
250.0
– – – – – – – –
– –
Food Manufacturers
216
220
Kfar Giladi Quarries
248.5
25.0
– – – – –
104.2 130 1,911.6
–
Building Products &
Infrastructure
243
221
Magal
247.7
-10.7 199.5 80.5 -8.6
12.2 4.9 217.7 328
755.3
–
Defense industry
208
222
Crow Technologies
243.7
0.6 236.5 97.0 0.1
– –
68.7 500
487.4
–
Electronic Systems
-
223
Nextcom
241.0
1.4
– – –
2.9 1.2
43.9 335
719.5
–
Electricity Producers &
Infrastructures
231
224
Gadot Biochemical Industries
239.0
-8.1
– – – – – –
105 2,276.2
Delek Group
Chemicals, Minerals, Refinery
204
225
Golan Plastic Products
238.1
0.0 134.4 56.5 -6.1
15.9 6.7 171.8 211 1,128.2
Kibbutz Shaar Hagolan Plastics , Rubber & Glass
214
226
Plastopil
234.3
-6.6 181.8 77.6 -7.5
0.3 0.1 112.3 273
858.3
Kibbutz Hazorea
Plastics , Rubber & Glass
223
227
Brand
227.6
-7.0
65.9 28.9 1,842.7
0.8 0.4
66.7 375
607.0
KCPS Energy Industries Metal Products
225
228
Emilia
226.5
-5.0 101.2 44.7 11.5
– –
19.4 383
591.4
Emilia Development
(O.F.G)
Pharmaceutical & Cosmetics
229
229
Sysnet - Software
225.0
16.0
– – – – –
39.0 600
375.0
Amanet Management &
Systems
Software Development
249
230
Camel Sarid
225.0
– – – – – – –
230
978.3
Kibbutz Sarid
Metal Products
237
231
Alon Natural Gas Exploration
221.2
7.9
– – –
80.0 36.2
83.8
1 221,152.0
Alon Oil
Chemicals, Minerals, Refinery
242
232
Extal
220.0
– – – – – – –
290
758.6
–
Metal Products
236
233
Shaniv
219.1
13.8
4.2 1.9 -20.3
12.1 5.5
88.7 283
774.1
–
Wood & Paper Products
252
234
Starkist
215.0
– – – – – – –
160 1,343.8
Diplomat Distributors
(1968)
Food Manufacturers
240
235
Klir
211.0
– – – – – – –
250
844.0
–
Wood & Paper Products
239
236
Aromor Flavors and Fragrances
210.9
21.4 209.4 99.3 21.5
– –
146.5 112 1,882.6
International Flavors &
Fragrances
Chemicals, Minerals, Refinery
-
237
Aran Packaging
206.9
6.8 179.1 86.6 6.7
– – –
180 1,149.4
Kibbutz Nachshon
Plastics , Rubber & Glass
250
238
Sanlakol
201.0
2.6
4.8 2.4 -19.6
17.7 8.8 114.2 171 1,175.7
–
Food Manufacturers
245
239
Carmel Forge
201.0
2.9 182.6 90.9 1.6
– – –
199 1,010.1
United Technologies
International Corp.
Metal Products
247
240
A.V.T
200.1
3.4 198.1 99.0 2.8
10.8 5.4 118.0 229
873.9
–
Electronic Systems
251
241
Dganit Ein Bar food and bakery
Industries
200.0
– – – – – – –
400
500.0
–
Food Manufacturers
248
242
SHL - Alubin
200.0
– – – – – – –
245
816.3
–
Metal Products
246
243
Zeraim Gedera
200.0
-8.9 160.0 80.0 -6.4
– –
160.0 180 1,111.1
Syngenta Agroservice AG Agricultural Inputs
234
1
- The Data refurs to Intel Electronics, Intel Israel (74) & Intel Mobile Communication Israel.
Largest in Chemicals, Minerals & Refinery
1
ORL - BAZAN
21,342.9
-36.1
9,492.5 -43.7
44.5
873.2
4.1
3,408.7 1,481 14,411.1
–
3
2
ICL
21,008.7
-3.9 20,075.8
-3.7
95.6
1,978.4
9.4 11,815.3 13,558 1,549.5
Israel Corp.
4
3
Haifa Chemicals
2,192.9
-10.8
– – –
– –
–
800 2,741.1
TRI-HF llc
34
71
4
Naphtha
1,831.2
2.4
182.7 -29.7
10.0
123.3
6.7
967.2
281 6,516.9
J.O.E.L. Jerusalem Oil
Exploration
44
5
Gadiv Petrochemical
Industries
1,681.1
-28.2
1,466.8 -29.9
87.3
– –
590.9
100 16,811.0
Oil Refineries
*
6
Sano
1,484.2
-2.1
109.4 -14.9
7.4
116.0
7.8
877.0 1,673
887.1
–
56
72
7
Delek Drilling
821.2
18.5
– – –
433.6 52.8
1,334.4
13 63,169.9
Delek Energy Systems
95
8
Avner Oil Exploration
794.9
18.0
– – –
415.4 52.3
1,218.9
13 61,143.9
–
98
Company
Sales
Exports/Overseas Sales
Net Profit
Equity
Employees
Parent Company
MAIN
RANK
2016
Industry
Profile
NIS
Millions
Change
(%)
NIS
Millions
Change
(%)
% of Total
Sales
NIS
Millions
Profitability
(%)
NIS
Millions
No.
Sales per
Employee
NIS (000)
See
Page
rank 2016
64
2016
|
DUN’S
100
DUN’S
100
|
2016
DUN’S
100
|
2016
2016
|
DUN’S
100
Industrial Companies