


 59 / 730

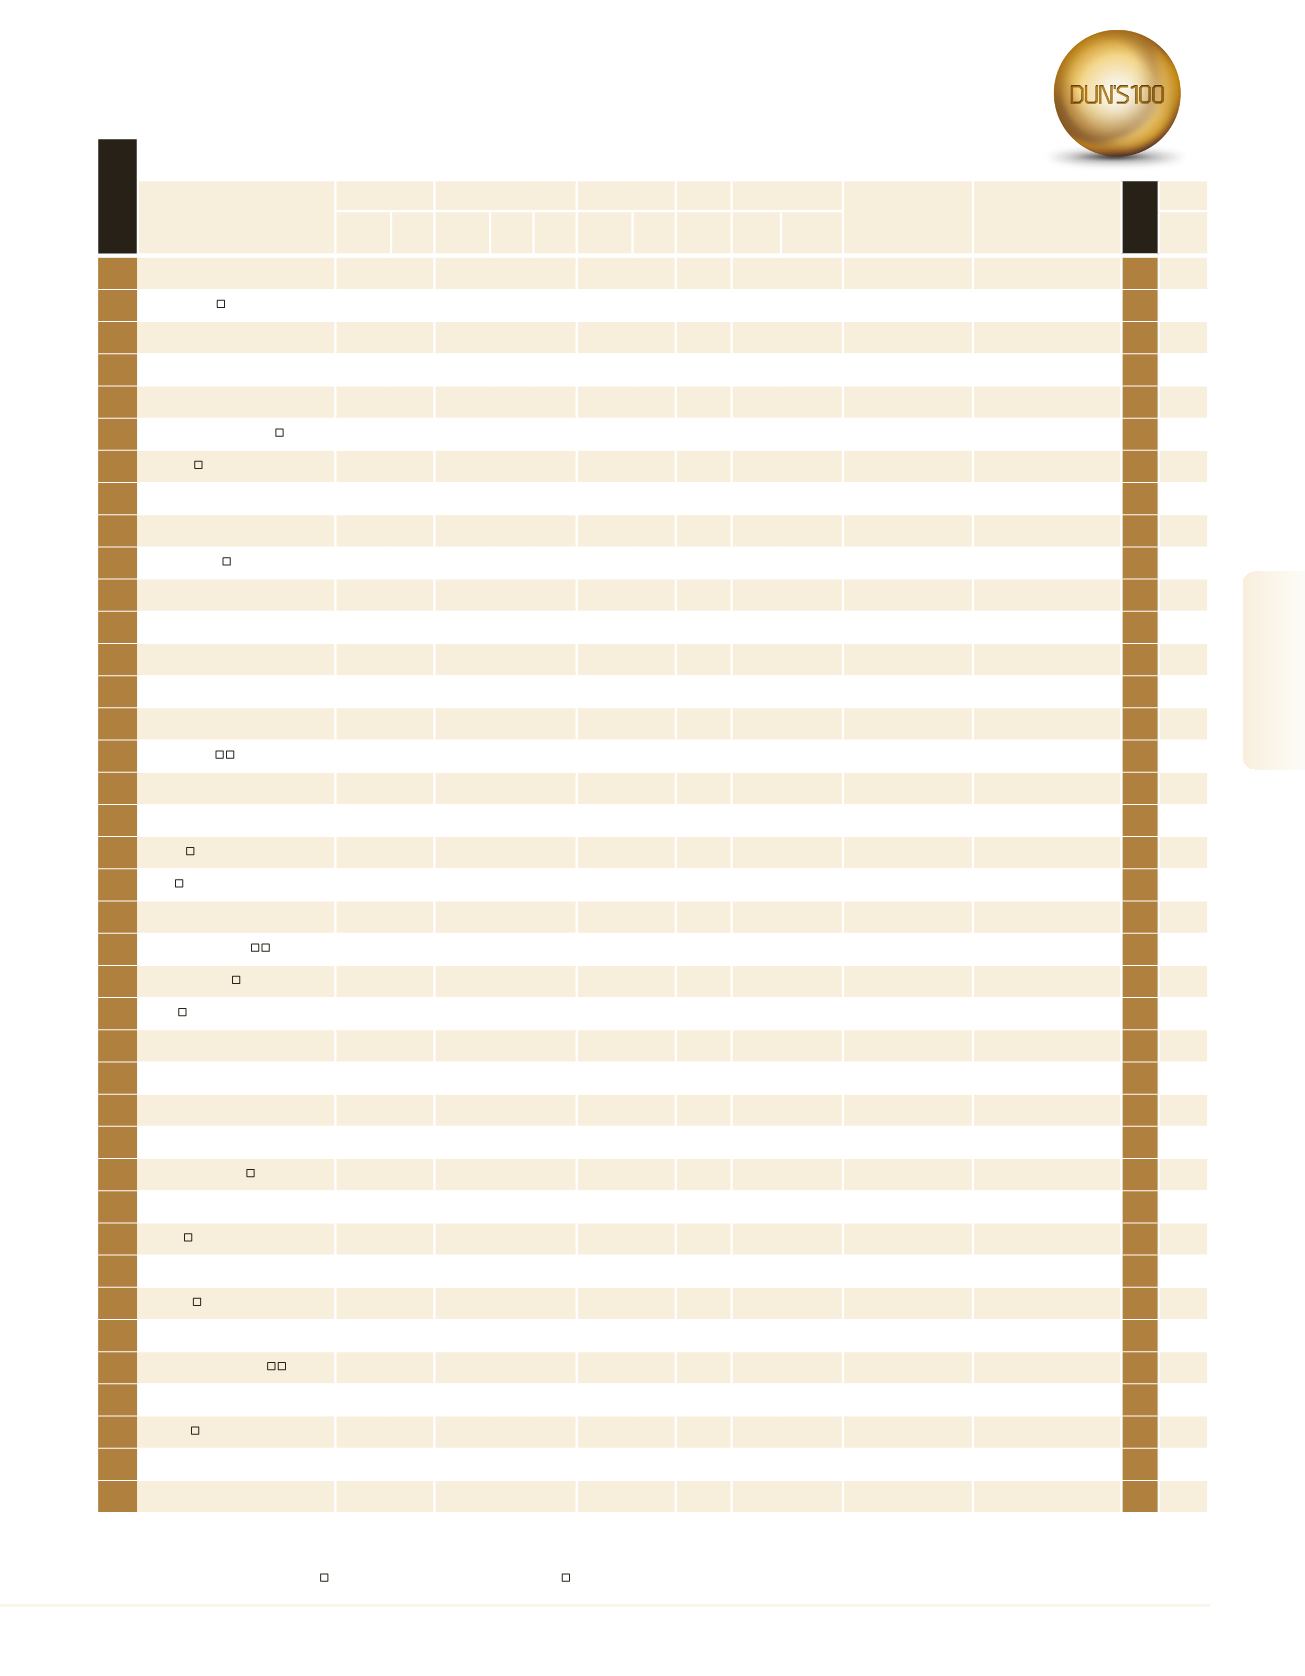
A subsidiary of a ranked company |
Company shares are traded in Israel |
Company shares are traded abroad |
Estimated figures
Company
Sales
Exports/Overseas Sales Net Profit
Equity
Employees
Parent Company
Sector
Rank 2015
Profile
NIS
Millions
Growth
(%)
NIS
Millions
% of
Total
Sales
Change
(%)
NIS
Millions
Profit-
ability
(%)
NIS
Millions
No.
Sales per
Employee
NIS (000)
See
Page
Largest Industrial Companies
X
X
by Sales Volume
rank 2016
38
Readymix
1,966.0
1.8
– – – – – –
1,070 1,837.4
Cemex S.A. de C.V.
Building Products &
Infrastructure
38
218
39
Caesarstone
1,941.6
21.3 1,787.5 92.1 23.0 302.3 15.6 1,561.7 1,282 1,514.5
–
Building Products &
Infrastructure
52
40
Taas-IMI
1,927.0
14.2 759.5 38.8 16.2
– – –
3,184
605.2
State of Israel
Defense industry
46
41
Playtika
1,902.0
50.1
– – – – – –
189 10,063.5
Caesars Interactive
Entertainment Israel
Internet
63
42
Applied Materials Israel
1,900.0
10.5
– – – – – –
1,054 1,802.7
Applied Materials Inc.
Electronic Systems
45
43
Africa Israel Industries
1,833.3
-3.7
35.6 1.9 21.6 -159.1 -8.7 156.3 1,767 1,037.5
Africa Israel Investments Metal Products
39
44
Naphtha
1,831.2
2.4 182.7 10.0 -29.7 123.3 6.7 967.2 281 6,516.9
J.O.E.L. Jerusalem Oil
Exploration
Chemicals, Minerals, Refinery
42
45
Tama Plastic Industry
1,792.7
5.8 1,739.8 97.0 6.2
– –
569.8 1,333 1,344.9
–
Plastics , Rubber & Glass
48
46
Perrigo Israel
1,780.0
5.3 1,483.0 83.3 5.2
– – –
1,200 1,483.3
Perrigo Company
Pharmaceutical & Cosmetics
49
551
47
Hadera Paper
1,741.4
-0.9 288.1 16.5 13.7 196.5 11.3 980.9 1,682 1,035.3
Clal Industries
Wood & Paper Products
44
48
Tosaf
1,710.0
6.9 1,197.0 70.0 8.8
– – –
950 1,800.0
Megides A.M.A.Assets
2000
Plastics , Rubber & Glass
53
*
Gadiv Petrochemical Industries 1,681.1
-28.2 1,466.8 87.3 -29.9
– –
590.9 100 16,811.0
Oil Refineries
Chemicals, Minerals, Refinery
*
49
Nilit
1,676.4
-5.6 1,663.2 99.2 -5.4
– – –
1,484 1,129.6
Nilit B.V.
Textiles & Fashion
43
50
Motorola Solutions Israel
1,650.0
– – – – – – –
1,000 1,650.0
Motorola Solutions Inc.
Communication Systems and
Equipment
47
519
51
Hogla Kimberly
1,642.2
2.0 377.5 23.0 -7.3
– –
264.1 1,201 1,367.4
Kimberly Clark
Wood & Paper Products
51
52
SodaStream
1,605.8
-12.3 1,562.7 97.3 -12.7
46.9 2.9 1,304.0 1,950
823.5
–
Food Manufacturers
41
53
Outbrain
1,550.0
– – – – – – –
550 2,818.2
Outbrain Inc.
Internet
81
54
Alliance
1,502.7
3.2 1,481.9 98.6 3.1
73.4 4.9 344.5 628 2,392.8
Alliance Tire Holding
Plastics , Rubber & Glass
55
55
Albaad
1,493.8
3.4 1,396.5 93.5 2.5
40.2 2.7 474.4 1,648
906.4
Moshav Massuot Yitzhak Wood & Paper Products
56
56
Sano
1,484.2
-2.1 109.4 7.4 -14.9 116.0 7.8 877.0 1,673
887.1
–
Chemicals, Minerals, Refinery
54
72
57
NCR Global
1,440.0
– – – – – – –
1,850
778.4
NCR CORPORATION
Software Development
59
58
Ceragon Networks
1,358.2
2.3 1,358.2 100.0 2.3
3.9 0.3 401.2 871 1,559.4
–
Communication Systems and
Equipment
60
59
Afcon Holdings
1,332.8
12.1
94.2 7.1 44.7
63.2 4.7 333.9 1,282 1,039.6
Shlomo Group
Electricity Producers &
Infrastructures
65
60
Avgol
1,324.6
0.2 1,272.0 96.0 0.2 103.5 7.8 415.2 696 1,903.1
–
Plastics , Rubber & Glass
61
61
Taboola
1,308.0
74.9
– – – – – –
380 3,442.1
–
Internet
95
62
ECI Telecom
1,300.0
–
1,150.0 88.5
– – –
450.0 1,700
764.7
Epsilon 1
Communication Systems and
Equipment
62
63
Ironsource
1,300.0
18.2
– – – – – –
500 2,600.0
–
Internet
68
64
Miloubar
1,271.4
2.8
– – – – –
77.3 100 12,714.4
Milouot Bay Settlement
Development Co.
Agricultural Inputs
64
65
Palram Industries
1,256.1
10.2 1,147.1 91.3 10.2
39.3 3.1 541.4 1,272
987.5
Ramat Yohanan
Agriculture Development
Plastics , Rubber & Glass
67
66
GE Healthcare
1,250.0
-10.7 1,210.0 96.8 -10.9
– –
336.6 409 3,056.2
Versamed Medical
Systems
Medical Equipment
57
67
Tempo
1,137.1
5.2
74.0 6.5 48.0
77.7 6.8 377.0 1,023 1,111.5
Tempo Beer Industries
Food Manufacturers
70
68
Lumenis
1,100.0
– – – – – – –
1,200
916.7
–
Medical Equipment
72
69
Syneron
1,080.0
18.0 1,062.6 98.4 17.6 -24.6 -2.3 816.3 784 1,377.5
–
Medical Equipment
78
70
Hanson Israel
1,054.3
-0.5
– – – – – –
598 1,763.0
Heidelberg Cement AG Building Products &
Infrastructure
71
219
71
Matomy Media Group
1,053.3
24.0 1,052.1 99.9 24.0
25.7 2.4 422.2
–
– –
Internet
86
72
Xura - Formarly Comverse
1,053.0
-38.3
– – – – – –
1,500
702.0
Xura Inc.
Communication Systems and
Equipment
40
73
Plasson
1,046.4
4.7 857.9 82.0 3.1
51.6 4.9 735.0 1,776
589.2
Kibbutz Ma’agan Michael
Plastics , Rubber & Glass
75
74
Iskoor
1,013.0
-2.0
0.2 0.0 22.2
– –
353.5 449 2,256.2
Macsteel Global B.V.
Metal Products
73
*
Kornish Chen
1,010.0
4.7
– – – – – – –
–
Tnuva + Alef Bar
Food Manufacturers
*
59
2016
|
DUN’S
100
DUN’S
100
|
2016
DUN’S
100
|
2016
2016
|
DUN’S
100
Industrial Companies