


 57 / 730

Industrial Companies
I
ndustrial production in 2015 grew by
2.3% and in salaried jobs fell by 0.3%
compared with the corresponding pe-
riod of 2014.
1
In terms of high-tech sectors in January-May
2014 there was a continual fall in the trend
data for industrial manufacturing, and from
June 2014 to March 2015 there was a con-
tinual rise and from January 2016 there has
been a rise in the trend data.
Exports
In 2015, industrial, mining and quarrying
exports (not including diamonds) totaled
NIS 174.6 billion, 4.4% higher compared to
2014.
Detailing industrial exports according to the
strength of technology indicates a rise of
23.4% in high-tech industrial exports com-
pared to 2014. The main rise was recorded in
the aircraft, aerospace and auxiliary equipment
manufacturing sector and in the computer and
computerized electro-opticmanufacturing sec-
tor. Itemizing according to sectors shows a rise
of 20.2% in the computers and electro-optic
equipment manufacturing sector, and exports
in the pharmaceuticals production sector rose
by 14.8%.
Mixed high-tech industrial exports fell by
12.8%, with the fall mainly stemming a fall in
exports of commodities in the manufacture of
chemicals and their products. A fall in prices
was recorded in this sector worldwide. Tech-
nology mixed with traditional industry exports
fell 7.9% with the fall primarily in commodity
exports in the refined crude oil manufacturing
products sector. Traditional technology indus-
try exports rose 4.9% with exports in the tex-
tiles sector rising 10.9%compared to 2014 and
exports in the beverages sector rising 7.4%.
2
The Leading Companies in Industry
The average percentage change in the rev-
enue of the top 20 companies in the 2016
rankings was 2.4%, while the average
exports/overseas sales of the top 20 compa-
nies in the rankings rose by 2.1%, compared
with the average exports/overseas sales in
2014.
The average number of employees of these
companies maintained stability and rose by
just 0.3% compared with the average number
of employees in 2014.
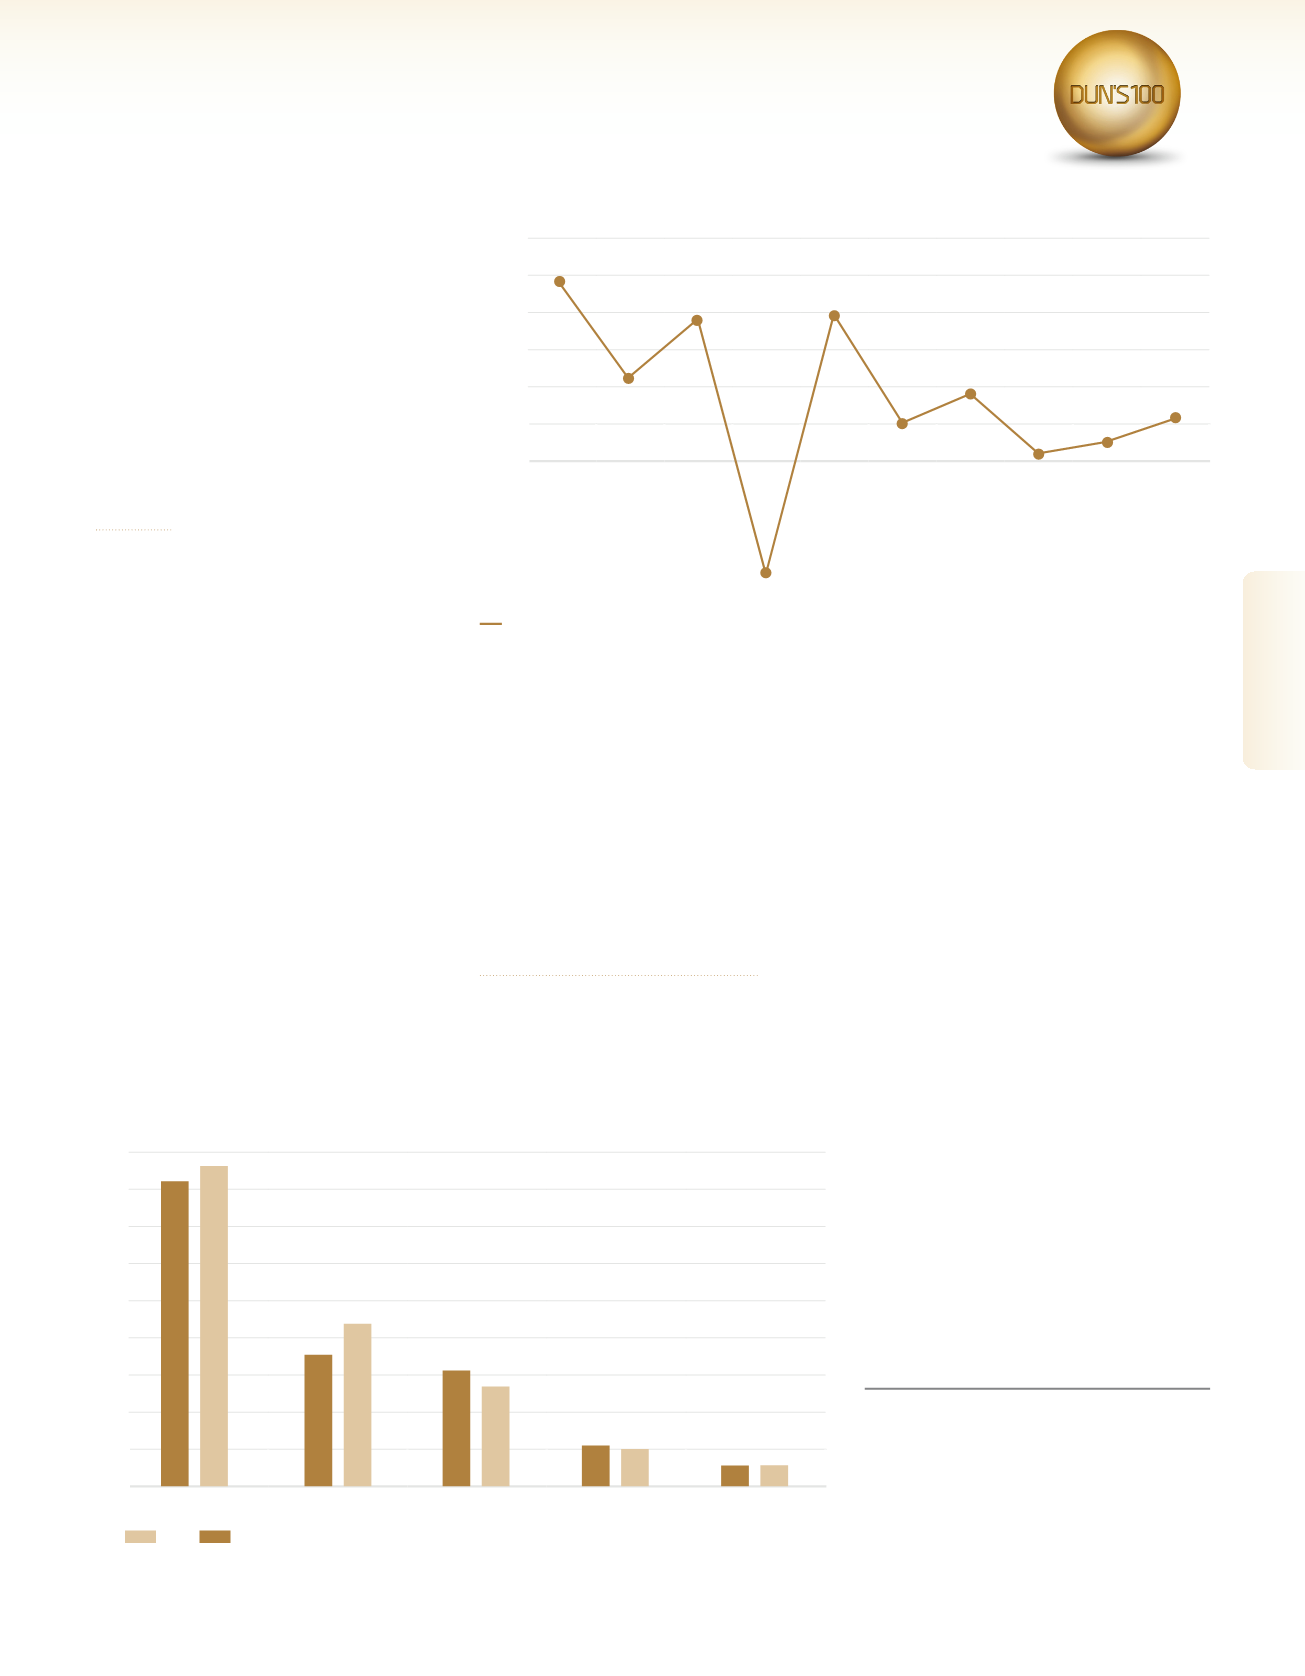
12%
9.8%
10%
7.8%
7.4%
8%
6%
3.7%
4%
2.3%
1.1%
4.5%
2%
0.5%
2.0%
0%
2015
2014
2013
2012
2011
2010
2009
2008
2007
2006
-2%
-4%
-6%
-6.0%
-8%
% Growth
Source: CBS
Development of the Industrial Product
180
160
140
120
100
80
60
40
20
0
Low technology
industries exports
Exports of medium-low
technology industries
Exports of medium-high
technology industries
High technology
industries exports
Industrial exports
)Excluding diamonds(
2015
2014
Source: CBS
167.2
70.9
61.8
23.3 21.5
11.2 11.7
53.9
87.5
174.6
Industrial Export 2014-2015
(in USD billions)
1
Source: Central Bureau of Statistics Industrial
production of the industrial, mining and quarrying
sectors December 2015 – February 2016.
2
Source: Central Bureau of Statistics: Israel's For-
eign Trade in 2015.
57
2016
|
DUN’S
100
DUN’S
100
|
2016
DUN’S
100
|
2016
2016
|
DUN’S
100
Industrial Companies