


 62 / 730

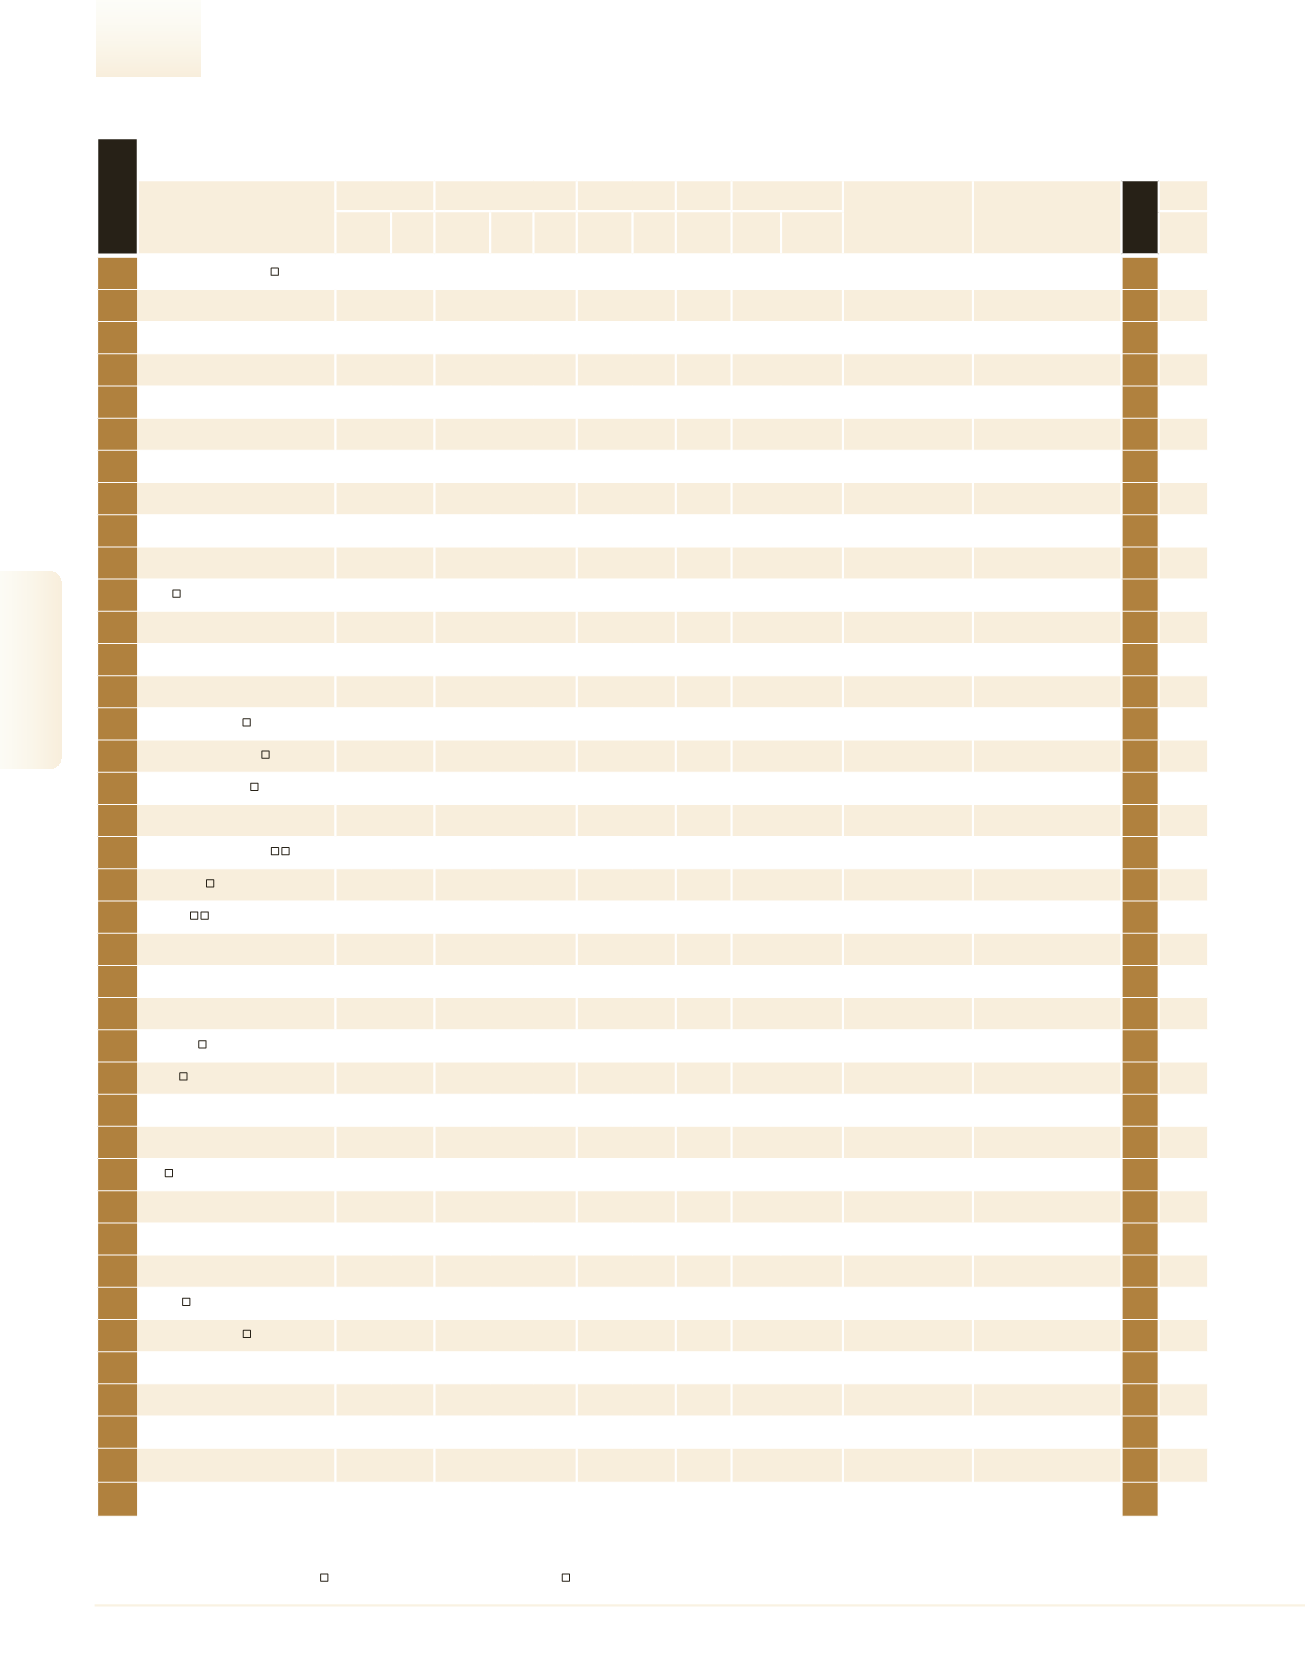
A subsidiary of a ranked company |
Company shares are traded in Israel |
Company shares are traded abroad |
Estimated figures
Industrial Companies Ranking
Company
Sales
Exports/Overseas Sales Net Profit
Equity
Employees
Parent Company
Sector
Rank 2015
Profile
NIS
Millions
Growth
(%)
NIS
Millions
% of
Total
Sales
Change
(%)
NIS
Millions
Profit-
ability
(%)
NIS
Millions
No.
Sales per
Employee
NIS (000)
See
Page
Largest Industrial Companies
X
X
by Sales Volume
rank 2016
146
Amiad Water Systems
461.7
8.9 428.9 92.9 11.7
19.7 4.3 217.3
–
– –
Filtration systems, irrigation
and water treatment
149
147
Solaredge Technologies
450.0
– – – – – – –
300 1,500.0
Solaredge Technologies
Inc
Electricity Producers &
Infrastructures
133
148
Stanleyworks Israel - Z.A.G
Industries
447.0
8.6 445.1 99.6 8.6
– –
858.4 580
770.7
Stanley Israel
Investments B.V.
Plastics , Rubber & Glass
140
149
Phibro Israel
445.0
– – – – – – –
290 1,534.5
Phibro Animal Health
Corp.
Chemicals, Minerals, Refinery
145
150
Tadiran Batteries
421.8
15.1 383.0 90.8 12.6
– –
386.8 571
738.7
Saft Sweden,AB
Chemicals, Minerals, Refinery
173
74
151
Aman Computers Group
420.0
5.0
– – – – – –
1,100
381.8
–
Software Development
157
152
Ex Libris
414.4
11.2 404.5 97.6 11.4
– –
980.7 650
637.5
ProQuest LLC
Software Development
170
153
Galam Group
412.7
-11.9 170.8 41.4 -16.3
– –
288.6 206 2,003.5
–
Food Manufacturers
136
*
Yotvata Dairies
410.9
-5.6
– – – – –
198.1 160 2,568.2
Strauss Group
Food Manufacturers
*
154
CLP Industries
410.0
– – – – – – –
385 1,064.9
Tadbik Pack
Plastics , Rubber & Glass
156
155
Vizrt
405.2
-20.0
– – –
37.8 9.3 466.9 596
679.8
–
Software Development
129
156
Zemach Feed Mill
399.2
-9.5
– – – – – – –
– –
Agricultural Inputs
144
*
Nirlat
396.5
0.2
– – – – – –
390 1,016.8
Inrom Investments
Industry
Building Products &
Infrastructure
162
157
Cellltick Technologies
395.8
0.6 395.8 100.0 0.6
– –
197.6 126 3,141.3
Cellltick Technologies Inc Software Development
165
158
Middle East Tube
393.5
-4.0
– – –
13.0 3.3 247.6 368 1,069.3
B. Gaon Holdings
Metal Products
175
159
MagicJack VocalTec
392.4
-5.7
– – –
52.5 13.4 186.0
92 4,265.5
–
Communication Systems and
Equipment
152
160
Schnapp Batteries
390.7
10.5
– – –
23.1 5.9 179.9 195 2,003.5
–
Electricity Producers &
Infrastructures
176
161
Hishtil
390.0
– – – – – – –
450
866.7
–
Agricultural Inputs
163
162
Allot Communications
388.6
-7.3
– – –
-77.1 -19.8 637.6 517
751.6
–
Communication Systems and
Equipment
150
*
Plasto Sac
386.2
-1.2 166.8 43.2 4.0
-7.3 -1.9 184.1 327 1,181.1
Cargal
Plastics , Rubber & Glass
*
*
Camtek
385.9
22.1
– – –
-39.3 -10.2 266.1 498
774.8
Priortech
Electronic Systems
*
163
rendom logic
385.0
– – – – – – –
750
513.3
–
Software Development
-
164
SanDisk IL
382.9
-8.5
– – – – – –
562
681.2
SanDisk Corporation
Chips and semiconductors
151
165
Risco Group
379.8
-6.1 365.4 96.2 -7.4
– –
132.9 605
627.8
–
Electronic Systems
155
166
Ham-Let
379.3
11.6 364.2 96.0 11.2
23.9 6.3 263.2 584
649.4
–
Metal Products
187
167
BATM
377.4
-3.5 272.1 72.1 -4.3 -51.5 -13.6 319.8
–
– –
Communication Systems and
Equipment
166
168
Starplast
375.3
-7.1 364.6 97.1 -6.4
– –
191.3 439
854.9
Senior Schwartz Holdings Plastics , Rubber & Glass
167
*
Ganir
375.2
-7.6 174.4 46.5 -11.7
11.9 3.2 141.4 232 1,617.3
Gan Shmuel Foods
Food Manufacturers
*
169
Klil
372.6
-1.6
16.8 4.5 -28.3
43.1 11.6 231.0 301 1,238.0
Daboosh Investments
Metal Products
168
75
*
SCD
369.3
27.9 189.3 51.3 35.1
– –
438.4 420
879.3
Elbit Systems + Rafael
Defense industry
*
170
Gad Dairy
365.0
– – – – – – –
240 1,520.8
–
Food Manufacturers
186
171
Poliva
363.0
-3.5
– – – – – –
210 1,728.6
–
Food Manufacturers
169
172
Tefron
361.8
7.7 358.1 99.0 7.3 -15.3 -4.2 110.5 856
422.7
–
Textiles & Fashion
188
173
O.R Technologies
360.3
22.1 311.3 86.4 20.3
19.4 5.4
81.7 473
761.7
Inter Gama Investments Electronic Systems
200
174
SafeNet Data Security (Israel)
360.0
– – – – – – –
155 2,322.6
–
Software Development
180
175
A. L. Group
350.0
– – – – – – –
1,400
250.0
Alonim G.I.A. Holdings
Metal Products
178
176
Berman’s Bakery
350.0
– – – – – – –
900
388.9
–
Food Manufacturers
171
177
U.S.R Electronic Systems (1987)
350.0
– – – – – – –
550
636.4
–
Electronic Systems
179
178
Dubek
350.0
– – – – – – –
280 1,250.0
–
Tobbacco
164
76
62
2016
|
DUN’S
100
DUN’S
100
|
2016
DUN’S
100
|
2016
2016
|
DUN’S
100
Industrial Companies