


 67 / 730

A subsidiary of a ranked company |
Company shares are traded in Israel |
Company shares are traded abroad |
Estimated figures
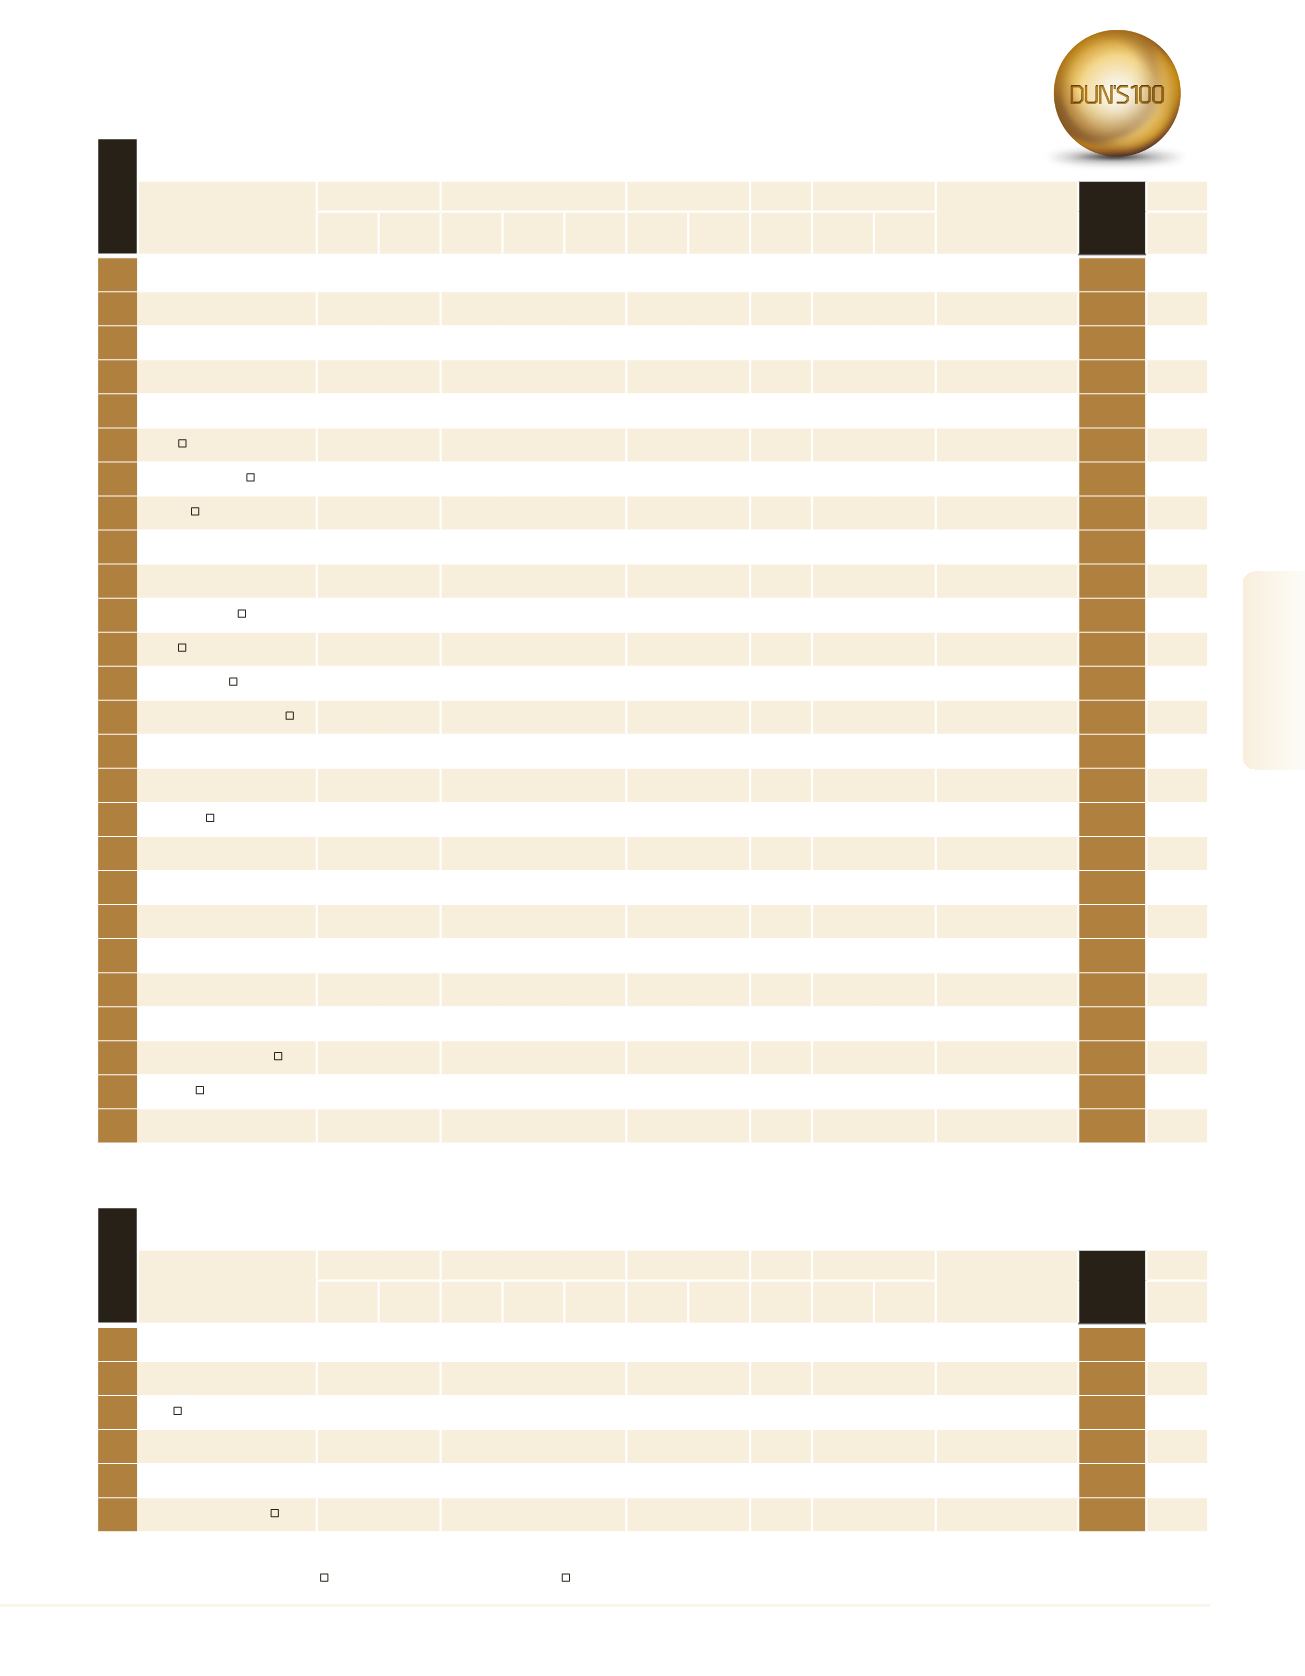
Largest in Plastics, Rubber and Glass
1
Keter Plastic
3,800.0
2.7
– – –
– –
–
4,300
883.7
–
21
2
Carmel Olefins
3,435.2
-12.2
– – –
418.3 12.2
1,583.8
–
–
Oil Refineries
*
3
Tama Plastic Industry
1,792.7
5.8
1,739.8
6.2
97.0
– –
569.8 1,333 1,344.9
–
45
4
Tosaf
1,710.0
6.9
1,197.0
8.8
70.0
– –
–
950 1,800.0
Megides A.M.A.Assets 2000
48
5
Alliance
1,502.7
3.2
1,481.9
3.1
98.6
73.4
4.9
344.5
628 2,392.8
Alliance Tire Holding
54
6
Avgol
1,324.6
0.2
1,272.0
0.2
96.0
103.5
7.8
415.2
696 1,903.1
–
61
7
Palram Industries
1,256.1
10.2
1,147.1
10.2
91.3
39.3
3.1
541.4 1,272
987.5
Ramat Yohanan Agriculture
Development
66
8
Plasson
1,046.4
4.7
857.9
3.1
82.0
51.6
4.9
735.0 1,776
589.2
Kibbutz Ma’agan Michael
74
9
Plazit Industries
900.0
–
– – –
– –
–
800 1,125.0
–
88
10
Shamir Optical Industry
825.0
–
– – –
– –
–
2,050
402.4
Shamir Optics Holdings
95
11
Kafrit Industries
747.0
2.2
603.4
-3.1
80.8
37.4
5.0
209.2
395 1,891.2
Kibbutz Kfar Aza
107
12
Raval
704.5
1.7
704.5
1.7 100.0
51.2
7.3
280.9 1,230
572.8
Kibbutz Revivim
112
13
Shalag Shamir
487.6
1.2
435.0
2.0
89.2
38.6
7.9
269.8
303 1,609.3
Shalag Shamir Holdings ACS
137
14
Ginegar Plastic Products
477.9
8.8
352.9
10.2
73.8
27.5
5.7
184.9
285 1,677.0
–
141
15
Stanleyworks Israel - Z.A.G
Industries
447.0
8.6
445.1
8.6
99.6
– –
858.4
580
770.7
Stanley Israel Investments B.V.
149
16
CLP Industries
410.0
–
– – –
– –
–
385 1,064.9
Tadbik Pack
155
17
Plasto Sac
386.2
-1.2
166.8
4.0
43.2
-7.3 -1.9
184.1
327 1,181.1
Cargal
*
18
Starplast
375.3
-7.1
364.6
-6.4
97.1
– –
191.3
439
854.9
Senior Schwartz Holdings
169
19
Elcam Medical
340.0
–
– – –
– –
–
600
566.7
–
183
20
Oran - Palmach Zuba Agricultural
Cooperative Society
282.2
52.2
229.3
64.3
81.3
– –
171.0
353
799.3
–
206
21
Politiv
275.0
15.6
135.0
8.0
49.1
– –
53.0
150 1,833.3
–
209
22
Phoenicia Flat Glass Industries
268.0
–
– – –
– –
–
285
940.4
Fortissimo Capital Fund
212
23
Palziv Ein Hanatziv
255.0
–
– – –
– –
–
480
531.3
Kibbutz Ein Hanaziv
218
24
Golan Plastic Products
238.1
0.0
134.4
-6.1
56.5
15.9
6.7
171.8
211 1,128.2
Kibbutz Shaar Hagolan
226
25
Plastopil
234.3
-6.6
181.8
-7.5
77.6
0.3
0.1
112.3
273
858.3
Kibbutz Hazorea
227
26
Aran Packaging
206.9
6.8
179.1
6.7
86.6
– –
–
180 1,149.4
Kibbutz Nachshon
238
Company
Sales
Exports/Overseas Sales
Net Profit
Equity
Employees
Parent Company
MAIN
RANK
2016
Industry
Profile
NIS
Millions
Change
(%)
NIS
Millions
Change
(%)
% of Total
Sales
NIS
Millions
Profitability
(%)
NIS
Millions
No.
Sales per
Employee
NIS (000)
See
Page
rank 2016
Filtration systems, irrigation and water treatment
1
Netafim
3,195.0
15.5
– – –
– –
– –
– –
26
70
2
I.D.E. Technologies
673.8
-32.3
343.8 -52.5
51.0
– –
946.5
451 1,493.9
Israel Chemicals +Delek
Infrastructure
*
3
Arad
635.7
5.9
513.1
7.2
80.7
64.6 10.2
357.7
816
779.1
–
115
4
NaanDan Jain Irrigation
486.6
5.6
438.4
7.6
90.1
– –
–
500
973.2
Jain Irrigation System
138
5
EMS
473.6
-0.1
– – –
– –
155.6
467 1,014.1
Mekorot National Water
Company
141
6
Amiad Water Systems
461.7
8.9
428.9
11.7
92.9
19.7
4.3
217.3
–
– –
146
Company
Sales
Exports/Overseas Sales
Net Profit
Equity
Employees
Parent Company
MAIN
RANK
2016
Industry
Profile
NIS
Millions
Change
(%)
NIS
Millions
Change
(%)
% of Total
Sales
NIS
Millions
Profitability
(%)
NIS
Millions
No.
Sales per
Employee
NIS (000)
See
Page
rank 2016
67
2016
|
DUN’S
100
DUN’S
100
|
2016
DUN’S
100
|
2016
2016
|
DUN’S
100
Industrial Companies