


 63 / 730

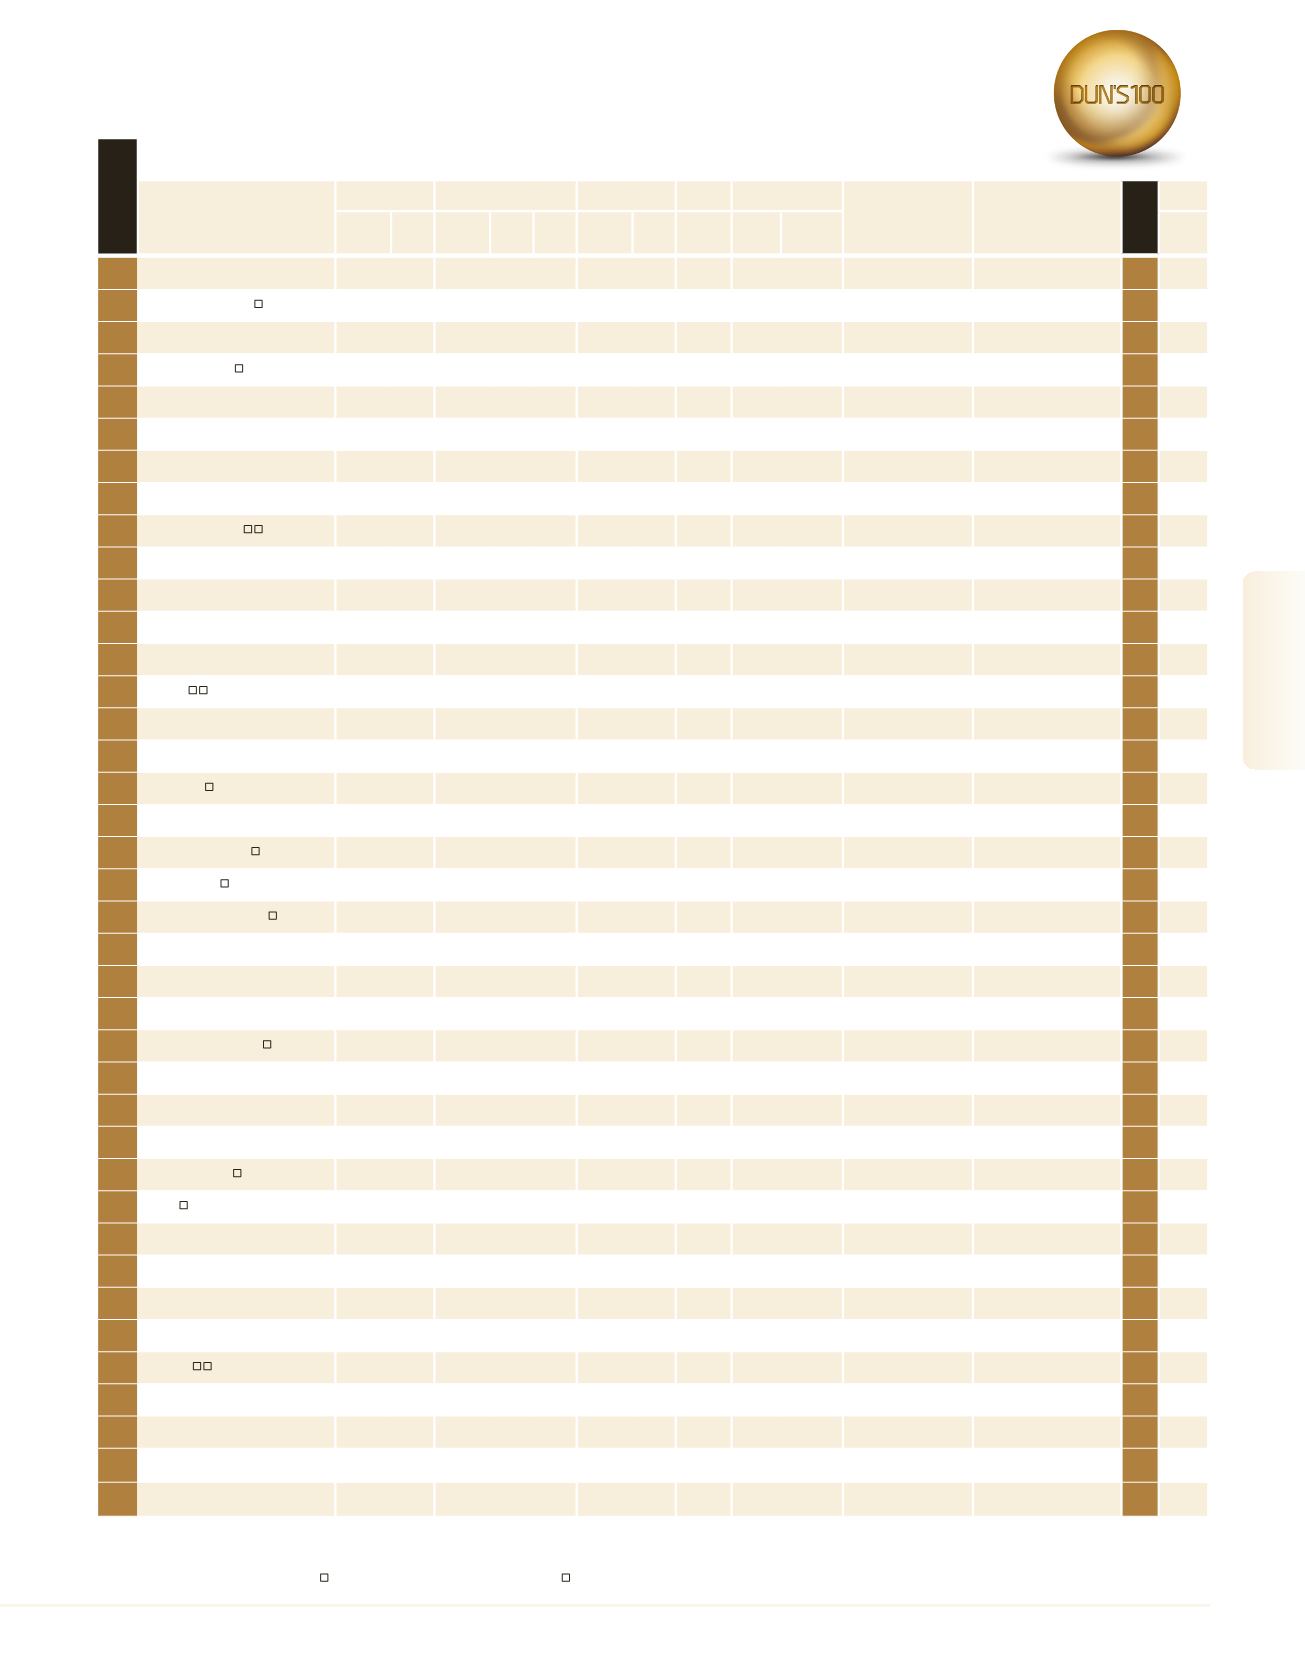
A subsidiary of a ranked company |
Company shares are traded in Israel |
Company shares are traded abroad |
Estimated figures
Company
Sales
Exports/Overseas Sales Net Profit
Equity
Employees
Parent Company
Sector
Rank 2015
Profile
NIS
Millions
Growth
(%)
NIS
Millions
% of
Total
Sales
Change
(%)
NIS
Millions
Profit-
ability
(%)
NIS
Millions
No.
Sales per
Employee
NIS (000)
See
Page
Largest Industrial Companies
X
X
by Sales Volume
rank 2016
179
Techjet
345.0
– – – – – – –
700
492.9
–
Metal Products
185
180
Maabarot Products
342.4
-5.3
60.4 17.6 -21.0
15.8 4.6 383.9 450
760.8
Maabarot A.C.S.
Food Manufacturers
174
181
Sizmek Technologies
341.0
-7.8
– – – – – –
272 1,253.6
Sizmek Technologies Inc. Internet
172
*
Ashot Ashkelon
340.9
20.0 146.3 42.9 25.7
17.2 5.1 224.3 495
688.8
Taas-IMI
Metal Products
*
182
Elcam Medical
340.0
– – – – – – –
600
566.7
–
Plastics , Rubber & Glass
190
*
Neviot
340.0
– – – – – – –
350
971.4
Coca Cola (Israel)
Food Manufacturers
*
183
Danshar (1963)
338.5
0.3
1.3 0.4 -54.0
– –
59.1 815
415.3
Danshar Holdings (2003)
Food Manufacturers
182
184
M.B. Kosher Chickens
336.0
20.6
– – – – –
65.0 540
622.2
–
Food Manufacturers
-
185
TAT Technologies
332.7
15.2 313.6 94.3 16.8
22.7 6.8 356.7 623
534.1
FIMI ISRAEL
OPPORTUNITY FUND
Metal Products
205
186
Haargaz Achzakot
330.0
– – – – – – –
560
589.3
Haargaz Investments
Metal Products
191
187
Mul-T-Lock
330.0
– – – – – – –
490
673.5
Assa Abloy AB
Metal Products
183
188
S.C.R Engineers
325.0
– – – – – – –
320 1,015.6
–
Electronic Systems
224
189
Isralift
324.0
8.4
– – – – – –
348
931.0
KONE
Metal Products
-
190
Silicom
321.6
18.9 321.6 100.0 18.9
64.2 20.0 440.3 238 1,351.2
–
Communication Systems and
Equipment
211
191
Tropical Degil Cosmetic
Industries
320.0
-7.0
67.0 20.9 -21.6
– – –
265 1,207.5
–
Pharmaceutical & Cosmetics
177
192
Degania Silicone
313.8
7.9 266.8 85.0 7.3
– –
127.3 1,700
184.6
–
Medical Equipment
202
193
Tadir-Gan
313.1
-0.3 311.7 99.5 -0.4
-8.8 -2.8 106.0 629
497.8
–
Metal Products
193
194
Pazkar
305.0
– – – – – – –
85 3,588.2
Paz Oil Company
Building Products &
Infrastructure
194
*
P.C.B Technologies
304.0
-16.2
70.3 23.1 -15.4
-3.6 -1.2 221.3 647
469.8
Priortech
Defense industry
*
195
Hamat Group
302.4
1.3
43.5 14.4 -1.2
33.7 11.2 122.1 383
789.5
–
Building Products &
Infrastructure
199
196
Bet Shemesh Engines
300.2
7.6 247.1 82.3 9.6
30.3 10.1 189.0 634
473.4
–
Metal Products
207
197
Dr. Fischer
300.0
– – – – – – –
740
405.4
Fischer Pharmaceutical
Laboratories
Pharmaceutical & Cosmetics
195
198
Best Carton
300.0
– – – – – – –
200 1,500.0
–
Wood & Paper Products
184
*
HBO
295.0
– – – – – – –
50 5,900.0
Oil Refineries
Chemicals, Minerals, Refinery
*
199
Taptica International
294.7
30.5 274.5 93.1 32.8
8.4 2.8 176.7
–
– –
Internet
233
200
Kenshoo
290.0
– – – – – – –
570
508.8
–
Software Development
212
201
Sharon Laboratories
290.0
–
70.0 24.1
– – – –
248 1,169.4
–
Chemicals, Minerals, Refinery
203
202
Henkel Soad
290.0
– – – – – – –
65 4,461.5
Henkel KGaa
Pharmaceutical & Cosmetics
197
203
Inter Industries
289.6
3.3
1.8 0.6 188.6
6.7 2.3
82.6 315
919.3
–
Electricity Producers &
Infrastructures
206
543
204
F.M.S.
283.5
15.9 265.1 93.5 16.7
74.8 26.4 172.9 130 2,180.9
–
Defense industry
226
205
Oran - Palmach Zuba
Agricultural Cooperative Society
282.2
52.2 229.3 81.3 64.3
– –
171.0 353
799.3
–
Plastics , Rubber & Glass
258
206
Oridion Systems
280.0
– – – – – – –
190 1,473.7
Covidien
Medical Equipment
210
207
Pandoor
275.0
7.4
– – – – –
350.0 234 1,175.2
Garlam
Building Products &
Infrastructure
220
221
208
Politiv
275.0
15.6 135.0 49.1 8.0
– –
53.0 150 1,833.3
–
Plastics , Rubber & Glass
230
209
Kamada
271.7
6.9
– – –
-43.8 -16.1 282.9 319
851.8
–
Pharmaceutical & Cosmetics
221
210
Rav Bariach
270.0
17.4
20.0 7.4
– – – –
600
450.0
Doors (08) Industries
Metal Products
232
211
Phoenicia Flat Glass Industries
268.0
– – – – – – –
285
940.4
Fortissimo Capital Fund Plastics , Rubber & Glass
209
212
Teldor Cables & Systems
265.0
– – – – – – –
340
779.4
–
Communication Systems and
Equipment
215
213
Makor Haformaika
265.0
– – – – – – –
230 1,152.2
–
Wood & Paper Products
217
63
2016
|
DUN’S
100
DUN’S
100
|
2016
DUN’S
100
|
2016
2016
|
DUN’S
100
Industrial Companies