


 58 / 730

A subsidiary of a ranked company |
Company shares are traded in Israel |
Company shares are traded abroad |
Estimated figures
Industrial Companies Ranking
1
The Data refers to Intel Electronics, Intel Israel (74) & Intel Mobile Communication Israel
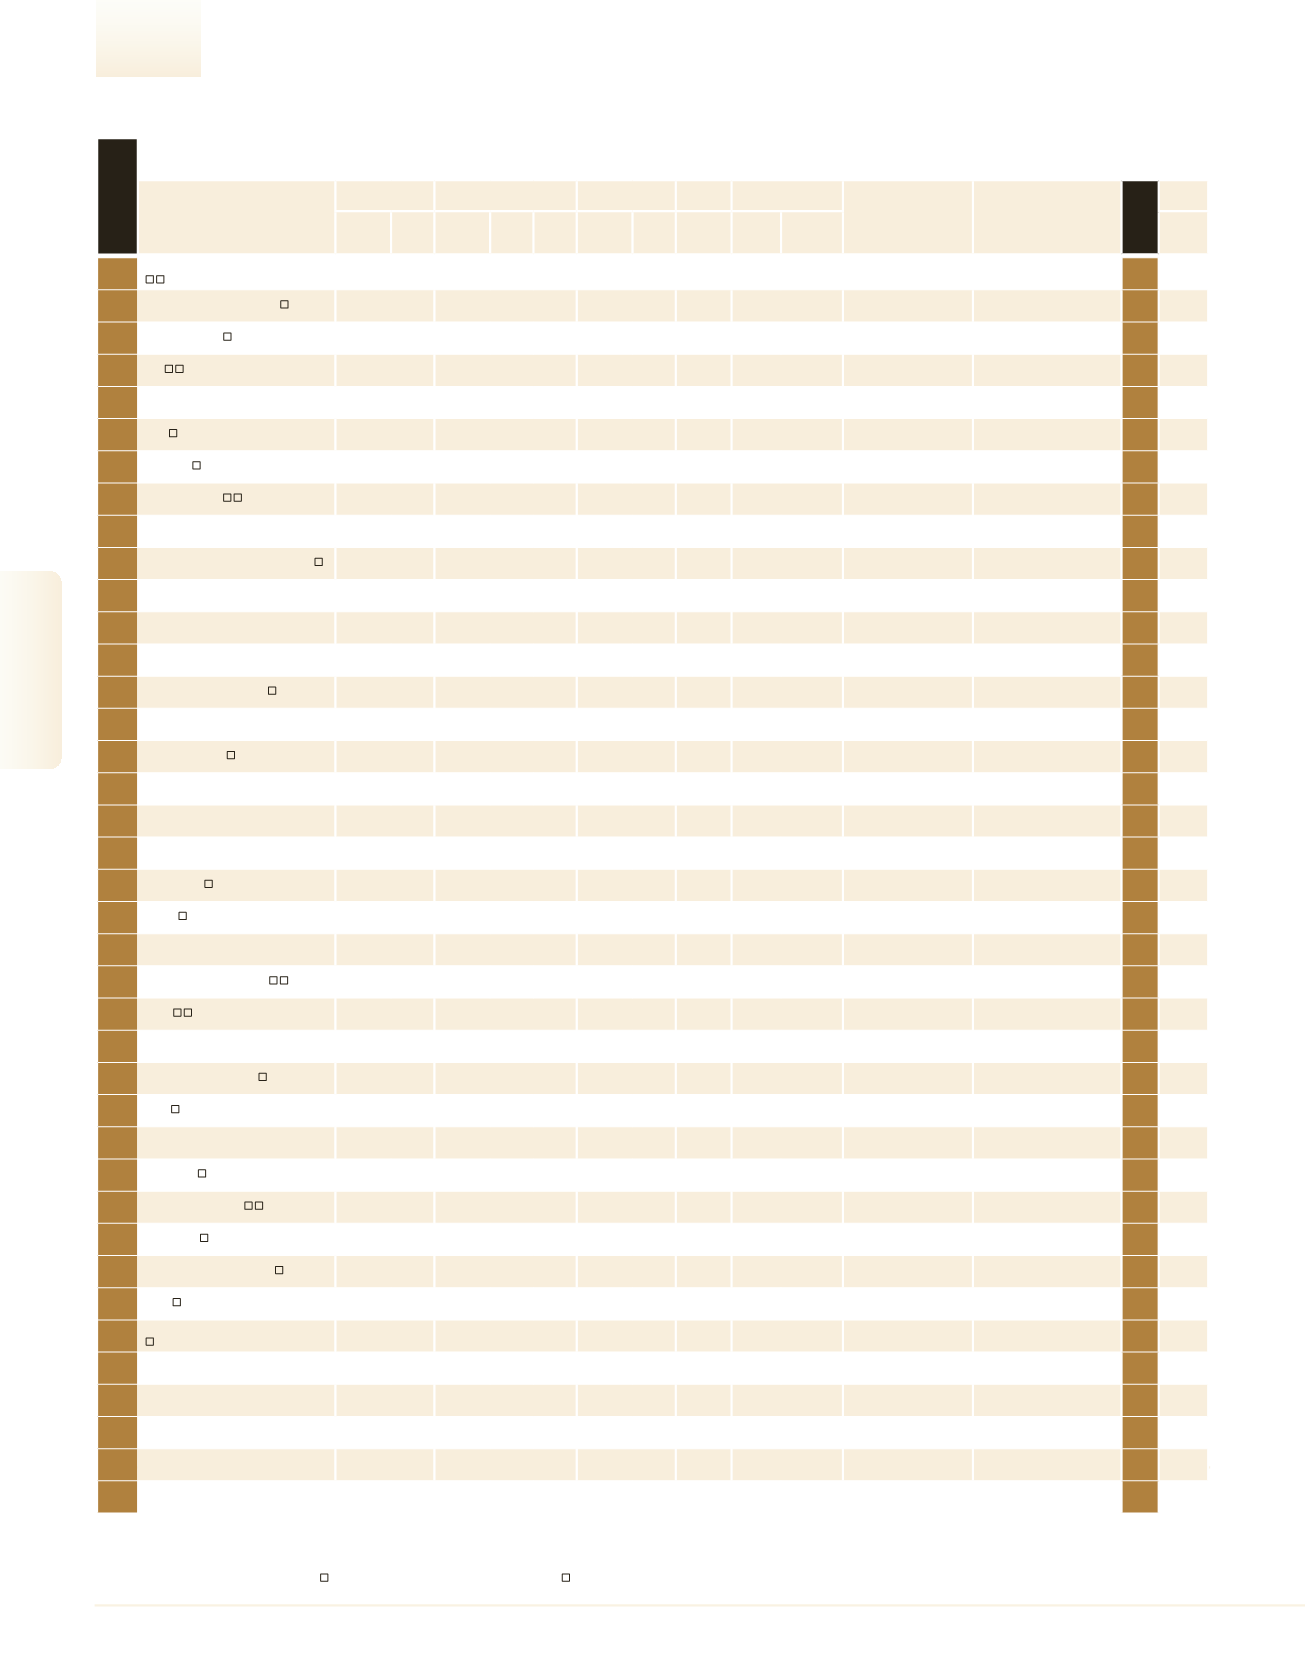
Largest Industrial Companies
by Sales Volume
1
Teva Pharmaceutical Industries
76,385.4
5.3 73,636.0 96.4 5.4 6,114.1 8.0 116,158.6 42,888 1,781.0
–
Pharmaceutical & Cosmetics
1
550
2
The Israel Electric Corp.
23,058.0
-8.9
– – –
223.0 1.0 16,694.0 12,077 1,909.2
State of Israel
Electricity Producers &
Infrastructures
3
540
3
ORL - BAZAN
21,342.9
-36.1 9,492.5 44.5 -43.7 873.2 4.1 3,408.7 1,481 14,411.1
–
Chemicals, Minerals, Refinery
2
4
ICL
21,008.7
-3.9 20,075.8 95.6 -3.7 1,978.4 9.4 11,815.3 13,558 1,549.5
Israel Corp.
Chemicals, Minerals, Refinery
4
5
Intel
1
15,916.9
4.8 15,916.9 100.0 4.8
– – –
10,000 1,591.7
Intel Corporation
Chips and semiconductors
5
6
I.A.I
14,412.6
5.3 11,295.3 78.4 5.8
31.1 0.2 3,882.5 15,734
916.0
State of Israel
Defense industry
6
514
7
Amdocs
14,162.1
11.1
– – –
1,734.2 12.2 13,293.5 24,950
567.6
–
Software Development
7
8
Elbit Systems
12,078.9
14.1 9,682.2 80.2 16.7 787.1 6.5 5,440.7 12,134
995.5
–
Defense industry
10
9
Iscar
12,000.0
– – – – – – –
12,000 1,000.0
IMC International
Metalworking
Metal Products
8
10
ADAMA Agricultural Solutions
11,909.0
3.3 11,542.3 96.9 3.5 428.0 3.6 6,113.0 4,864 2,448.4
–
Agricultural Inputs
9
11
Rafael
7,845.0
11.7 4,840.4 61.7 26.3 459.0 5.9 3,188.7 7,245 1,082.8
State of Israel
Defense industry
11
515
12
Tnuva Group
6,900.0
– – – – – – –
6,000 1,150.0
–
Food Manufacturers
12
13
Vishay Israel
6,538.4
-0.7 6,488.7 99.2 -0.8
– – –
12,099
540.4
Vishay Intertechnology
Inc.
Chips and semiconductors
13
14
Check Point Software
6,335.0
18.4
– – –
2,665.9 42.1 13,781.3 3,898 1,625.2
–
Software Development
17
15
Coca Cola (Israel)
5,600.0
– – – – – – –
5,000 1,120.0
–
Food Manufacturers
15
16
Strauss Group
5,183.0
-4.3 1,407.0 27.1 -5.1 257.0 5.0 1,705.0 10,830
478.6
Strauss Holding
Food Manufacturers
16
17
I.C. Power Asia Development
5,010.2
2.1
– – – – – – –
–
Kenon Holdings
Electricity Producers &
Infrastructures
19
*
Elta
4,290.1
7.7 3,580.1 83.5 8.2
– –
1,676.2 3,400 1,261.8
Israel Aerospace Ind.
Defense industry
*
516
18
Indigo
4,200.0
– – – – – – –
2,200 1,909.1
HP Inc
Electronic Systems
18
19
Delta Galil
4,197.8
13.7 3,708.8 88.4 14.6 170.4 4.1 1,390.5 8,750
479.7
–
Textiles & Fashion
22
20
Osem
4,171.9
-2.0 645.3 15.5 -4.6 384.2 9.2 2,718.0 4,954
842.1
Nestle S.A.
Food Manufacturers
20
21
Keter Plastic
3,800.0
2.7
– – – – – –
4,300
883.7
–
Plastics , Rubber & Glass
21
22
Tower Semiconductor
3,733.6
26.0
– – –
-113.2 -3.0 1,550.4
–
– –
Chips and semiconductors
24
23
NICE
3,602.6
15.5 3,586.2 99.5 15.6 546.4 15.2 5,521.9 3,316 1,086.4
–
Software Development
23
*
Carmel Olefins
3,435.2
-12.2
– – –
418.3 12.2 1,583.8
–
–
Oil Refineries
Plastics , Rubber & Glass
*
24
Frutarom Industries
3,392.5
15.7 3,086.9 91.0 17.3 368.7 10.9 2,126.2 3,734
908.5
–
Food Manufacturers
25
25
Taro
3,354.2
23.5 3,322.5 99.1 24.0 1,882.3 56.1 5,530.6 1,339 2,505.0
–
Pharmaceutical & Cosmetics
27
26
Netafim
3,195.0
15.5
– – – – – – –
– –
Filtration systems, irrigation
and water treatment
26
70
27
Orbotech
2,925.0
40.3 2,925.0 100.0 40.3 220.7 7.5 2,218.3 2,295 1,274.5
–
Electronic Systems
35
28
Formula Systems
2,917.3
28.1 866.5 29.7 130.2 286.5 9.8 1,762.0 10,981
265.7
–
Software Development
33
29
Stratasys
2,705.3
0.8
– – –
-5,338.7 -197.3 4,638.7 2,721
994.2
–
Electronic Systems
28
30
Mellanox Technologies
2,558.1
54.2 2,530.9 98.9 53.9 361.1 14.1 3,381.1 1,922 1,331.0
–
Chips and semiconductors
50
31
Neto
2,507.1
6.7
– – –
93.7 3.7 667.9 1,706 1,469.6
–
Food Manufacturers
31
32
Shapir Engineering & Industries
2,483.6
7.6
– – –
161.0 6.5 1,091.6 1,382 1,797.1
–
Building Products &
Infrastructure
32
143
33
Flex
2,294.8
-10.3
88.6 3.9 -38.5
– –
746.3 3,140
730.8
Flextronics Central B.V Electronic Systems
29
34
Haifa Chemicals
2,192.9
-10.8
– – – – – –
800 2,741.1
TRI-HF llc
Chemicals, Minerals, Refinery
30
71
35
Nesher
2,120.7
3.5
– – – – – –
541 3,919.9
Mashav - Initiating &
Develop.
Building Products &
Infrastructure
36
36
Unilever Israel
2,050.0
– – – – – – –
2,200
931.8
Unilever Holdings
Food Manufacturers
37
37
Ambar
2,039.1
-4.9
– – – – –
694.2 330 6,179.2
–
Agricultural Inputs
34
Company
Sales
Exports/Overseas Sales Net Profit
Equity
Employees
Parent Company
Sector
Rank 2015
Profile
NIS
Millions
Growth
(%)
NIS
Millions
% of
Total
Sales
Change
(%)
NIS
Millions
Profit-
ability
(%)
NIS
Millions
No.
Sales per
Employee
NIS (000)
See
Page
rank 2016
58
2016
|
DUN’S
100
DUN’S
100
|
2016
DUN’S
100
|
2016
2016
|
DUN’S
100
Industrial Companies