


 35 / 74

A subsidiary of a ranked company |
Company shares are traded in Israel |
Company shares are traded abroad |
Estimated figures
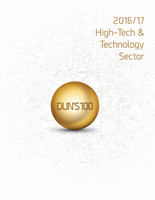
Software Services
1
IBM Israel
2,750.0
–
– –
–
2,650 1,037.7
IBM Corp.
10
2
Matrix IT
2,280.2
8.5
99.8
4.4
623.8
7,644
298.3
Formula Systems (1985)
12
3
One-1
1,269.2
7.8
66.3
5.2
230.2
3,225
393.5
Computer Direct Group
19
4
Hilan
1,167.9
124.5
66.8
5.7
199.3
2,817
414.6
–
23
5
Amanet
320.7
9.5
10.9
3.4
94.4
1,369
234.3
–
69
6
SQLink
305.0
15.5
– –
30.0
1,150
265.2
–
72
7
Sap Israel
223.8
11.4
– –
10.9
69 3,243.4
SAP AG
78
8
Gav Systems
197.0
23.9
– –
–
900
218.9
–
86
9
Elad Software Systems
180.0
4.1
– –
14.0
750
240.0
–
87
10
LADPC
151.0
–
– –
–
503
300.2
One Software Services (1997)
90
Company
Revenues
Net Profit
Equity
Employees
Parent Company
Main
Rank
2016
SERVICES
Profile
NIS
Millions
Change
(%)
NIS
Millions
Profitability
(%)
NIS
Millions
No.
Rev. per
Employee
NIS (000)
See
Page
rank 2016
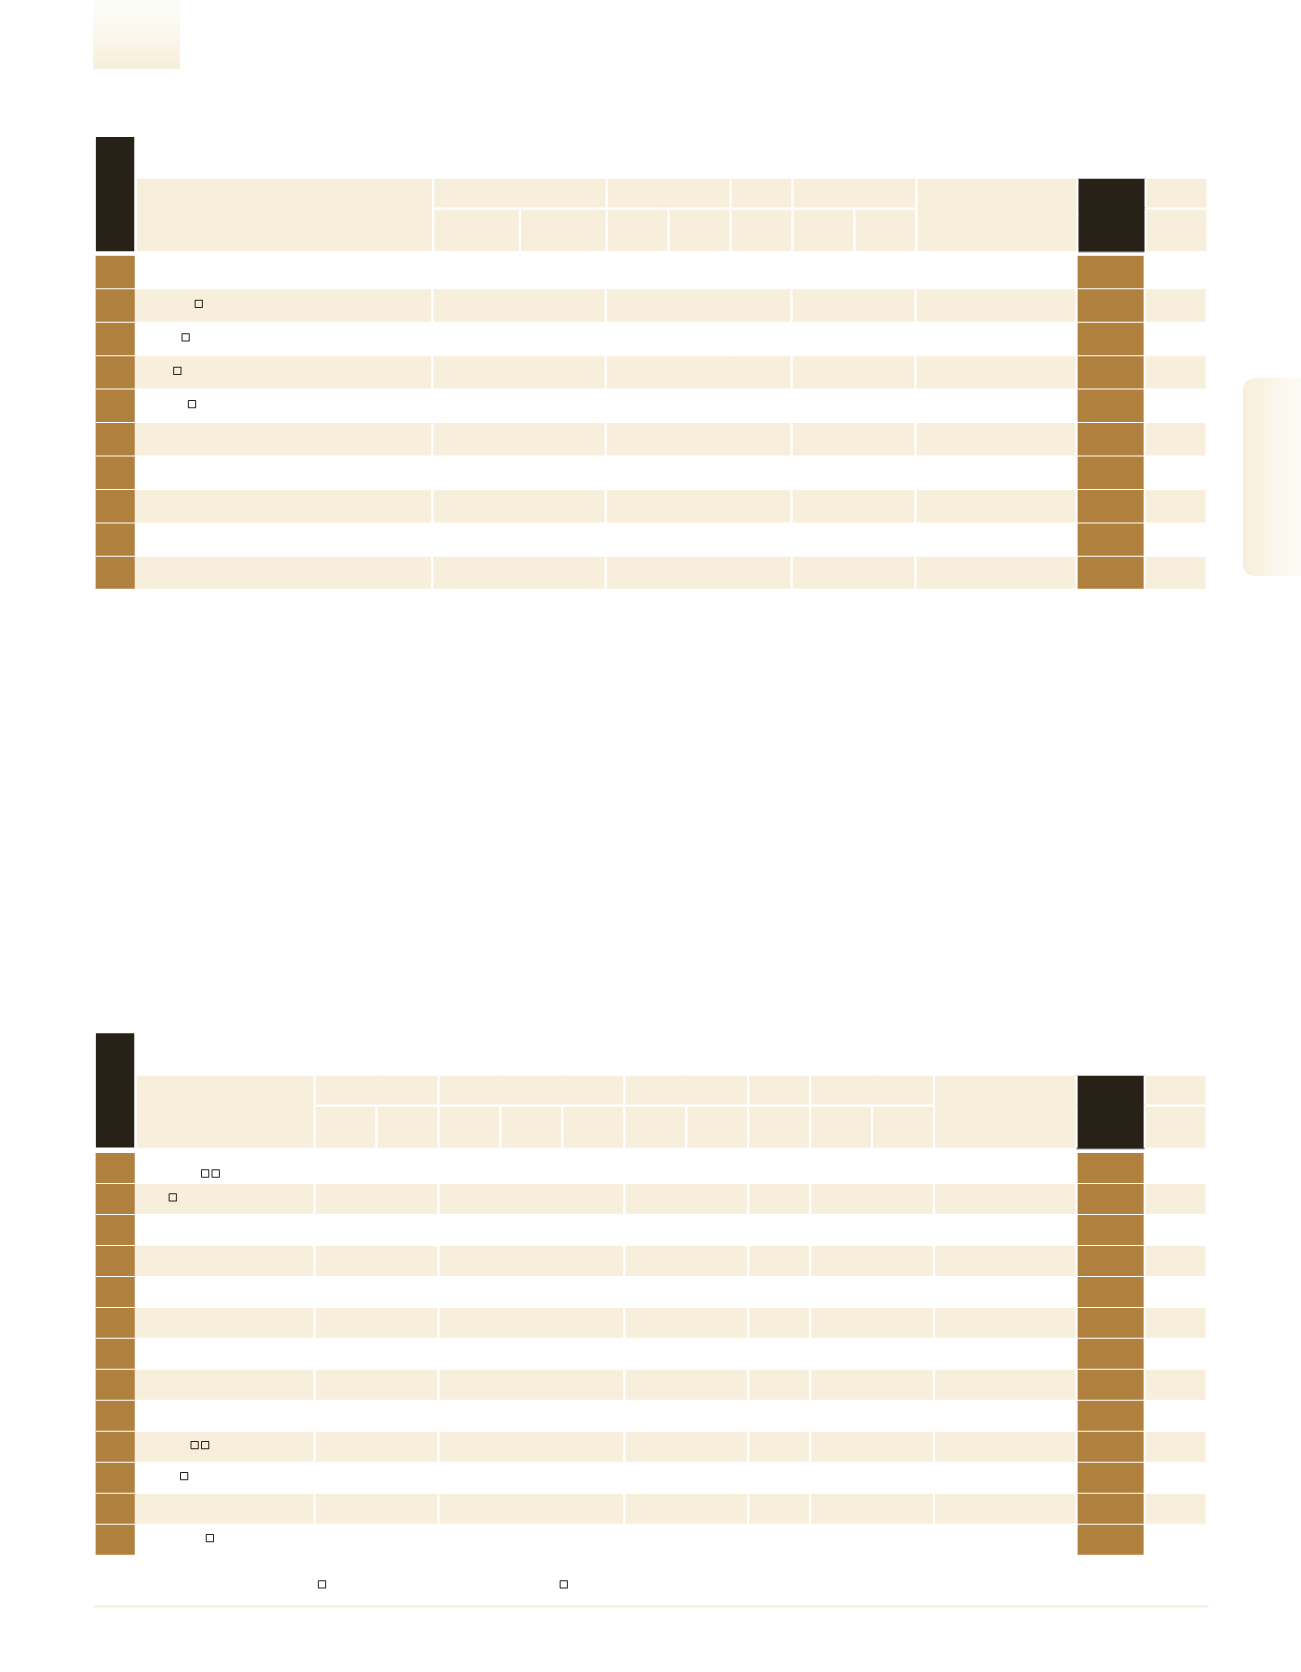
Company
Sales
Exports/Overseas Sales
Net Profit
Equity
Employees
Parent Company
MAIN
RANK
2016
Industry
Profile
NIS
Millions
Change
(%)
NIS
Millions
Change
(%)
% of Total
Sales
NIS
Millions
Profitability
(%)
NIS
Millions
No.
Sales per
Employee
NIS (000)
See
Page
Largest in Pharmaceuticals & Cosmetics
1
Teva Pharmaceutical
Industries
76,385.4
5.3 73,636.0
5.4
96.4
6,114.1
8.0 116,158.6 42,888 1,781.0
–
1
2
Taro
3,354.2
23.5
3,322.5
24.0
99.1
1,882.3 56.1
5,530.6 1,339 2,505.0
–
25
3
Perrigo Israel
1,780.0
5.3
1,483.0
5.2
83.3
– –
–
1,200 1,483.3
Perrigo Company
46
4
Dexcel Pharma
900.0
–
– – –
– –
–
895 1,005.6
Dexcel PT Israel
86
5
Omrix Biopharmaceuticals
615.6
55.3
– – –
– –
–
495 1,243.7
Johnson & Johnson
118
6
L’Oreal
487.0
-1.0
– – –
– –
–
1,105
440.7
L’Oreal S.A.
137
7
Tropical Degil Cosmetic
Industries
320.0
-7.0
67.0 -21.6
20.9
– –
–
265 1,207.5
–
191
8
Dr. Fischer
300.0
–
– – –
– –
–
740
405.4
Fischer Pharmaceutical
Laboratories
197
9
Henkel Soad
290.0
–
– – –
– –
–
65 4,461.5
Henkel KGaa
202
10
Kamada
271.7
6.9
– – –
-43.8 -16.1
282.9
319
851.8
–
209
11
Rekah
262.4
-2.8
– – –
-4.4 -1.7
123.0
594
441.8
–
215
12
Emilia
226.5
-5.0
101.2
11.5
44.7
– –
19.4
383
591.4
Emilia Development (O.F.G)
228
13
Enzymotec
195.9
16.2
190.7
16.9
97.4
26.0 13.3
533.5
195 1,004.4
–
244
rank 2016
Ranking Tables
2016/17
|
High-Tech & Technology -
DUN’S
100
35