


 562 / 730

A subsidiary of a ranked company |
Company shares are traded in Israel |
Company shares are traded abroad |
Estimated figures
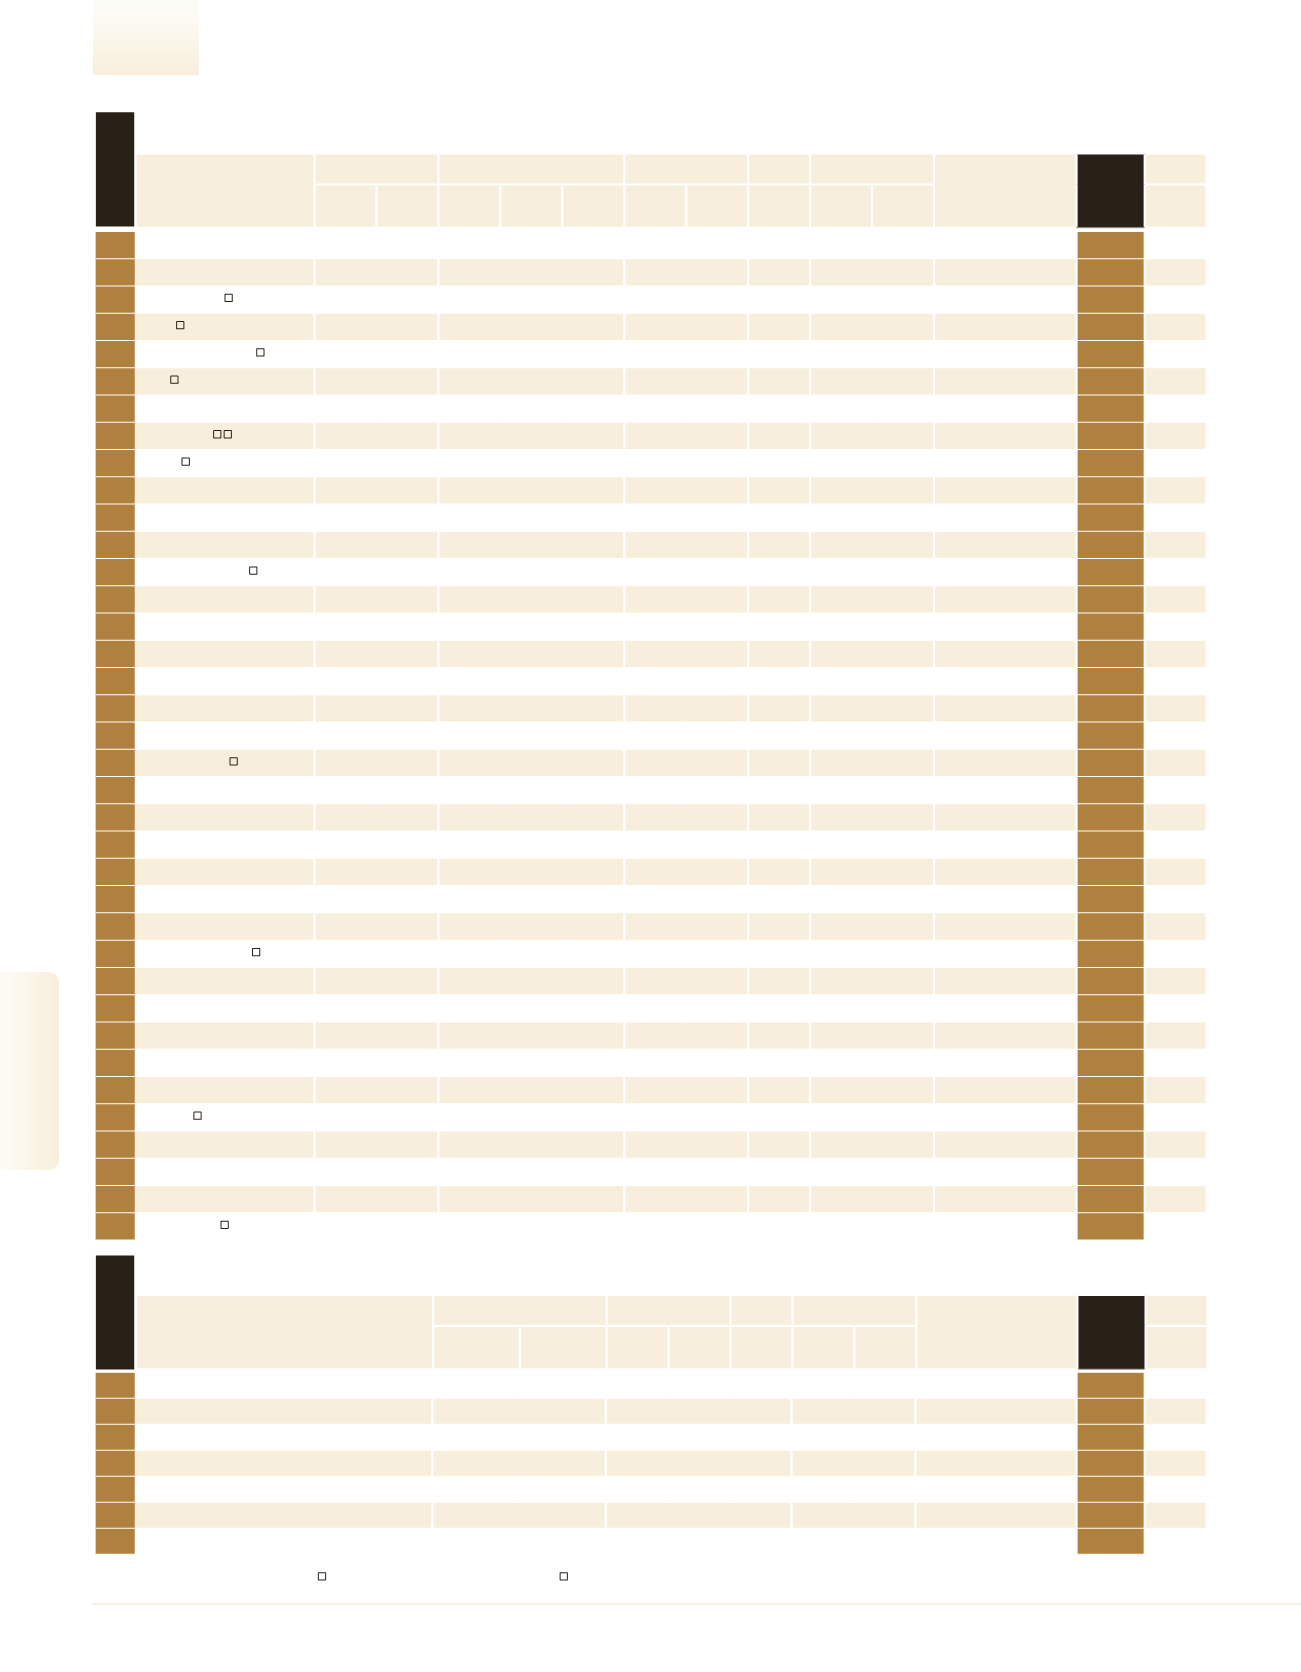
Food Industry Ranking
Company
Sales
Exports/Overseas Sales
Net Profit
Equity
Employees
Parent Company
MAIN
RANK
2016
Industry
Profile
NIS
Millions
Change
(%)
NIS
Millions
Change
(%)
% of Total
Sales
NIS
Millions
Profitability
(%)
NIS
Millions
No.
Sales per
Employee
NIS (000)
See
Page
Food Manufacturers
1
Tnuva Group
6,900.0
–
– – –
– –
–
6,000 1,150.0
–
12
2
Coca Cola (Israel)
5,600.0
–
– – –
– –
–
5,000 1,120.0
–
15
3
Strauss Group
5,183.0
-4.3
1,407.0
-5.1
27.1
257.0
5.0
1,705.0 10,830
478.6
Strauss Holding
16
4
Osem
4,171.9
-2.0
645.3
-4.6
15.5
384.2
9.2
2,718.0 4,954
842.1
Nestle S.A.
20
5
Frutarom Industries
3,392.5
15.7
3,086.9
17.3
91.0
368.7 10.9
2,126.2 3,734
908.5
–
24
6
Neto
2,507.1
6.7
– – –
93.7
3.7
667.9 1,706 1,469.6
–
31
7
Unilever Israel
2,050.0
–
– – –
– –
–
2,200
931.8
Unilever Holdings
36
8
SodaStream
1,605.8
-12.3
1,562.7 -12.7
97.3
46.9
2.9
1,304.0 1,950
823.5
–
52
9
Tempo
1,137.1
5.2
74.0
48.0
6.5
77.7
6.8
377.0 1,023 1,111.5
Tempo Beer Industries
67
10
Kornish Chen
1,010.0
4.7
– – –
– –
– –
–
Tnuva + Alef Bar
*
11
Tivall
992.2
-2.4
– – –
– –
495.3
704 1,409.4
Osem Investments
*
12
Jafora-Tabori
911.8
-0.1
– – –
– –
– –
–
Jaf-Ora
84
13
Gan Shmuel Foods
908.5
4.2
736.3
5.2
81.1
48.2
5.3
462.0
528 1,720.6
–
85
14
Of Tov
796.0
-8.3
60.0
–
7.5
– –
191.0
790 1,007.6
–
97
15
Baladi
790.0
24.8
– – –
– –
–
400 1,975.0
–
102
16
Of Yerushalayim Mehadrin
755.0
14.6
– – –
– –
185.0
850
888.2
–
105
17
CHS Israel Protein Foods
629.5
-0.8
15.3 -68.5
2.4
– –
–
110 5,723.1
CHS Industries
116
18
Gat Foods
620.0
1.6
475.0
3.3
76.6
– –
–
390 1,589.7
Coca Cola Israel
*
19
Soglowek
550.0
–
– – –
– –
–
800
687.5
–
124
20
Angel Bakeries
517.9
-4.0
2.8 -36.1
0.5
-11.8 -2.3
142.8 1,399
370.2
–
129
21
Galam Group
412.7
-11.9
170.8 -16.3
41.4
– –
288.6
206 2,003.5
–
153
22
Yotvata Dairies
410.9
-5.6
– – –
– –
198.1
160 2,568.2
Strauss Group
*
23
Ganir
375.2
-7.6
174.4 -11.7
46.5
11.9
3.2
141.4
232 1,617.3
Gan Shmuel Foods
*
24
Gad Dairy
365.0
–
– – –
– –
–
240 1,520.8
–
170
25
Poliva
363.0
-3.5
– – –
– –
–
210 1,728.6
–
171
26
Berman’s Bakery
350.0
–
– – –
– –
–
900
388.9
–
176
27
Maabarot Products
342.4
-5.3
60.4 -21.0
17.6
15.8
4.6
383.9
450
760.8
Maabarot A.C.S.
180
28
Neviot
340.0
–
– – –
– –
–
350
971.4
Coca Cola (Israel)
*
29
Danshar (1963)
338.5
0.3
1.3 -54.0
0.4
– –
59.1
815
415.3
Danshar Holdings (2003)
183
30
M.B. Kosher Chickens
336.0
20.6
– – –
– –
65.0
540
622.2
–
184
31
Wissotsky Tea
250.0
–
– – –
– –
– –
– –
219
32
Starkist
215.0
–
– – –
– –
–
160 1,343.8
Diplomat Distributors (1968)
234
33
Sanlakol
201.0
2.6
4.8 -19.6
2.4
17.7
8.8
114.2
171 1,175.7
–
238
34
Dganit Ein Bar food and bakery
Industries
200.0
–
– – –
– –
–
400
500.0
–
241
35
Tapugan Industries
169.0
-2.9
– – –
– –
–
125 1,352.0
–
263
36
Achva
149.4
2.7
16.4
-2.3
11.0
– –
26.8
205
728.9
Achdut Achva Holdings
274
37
Carmit Candy
128.3
2.9
40.9
9.2
31.9
2.8
2.2
56.9
174
737.6
–
284
rank 2016
562
2016
|
DUN’S
100
DUN’S
100
|
2016
DUN’S
100
|
2016
2016
|
DUN’S
100
Food Industry
Catering
1
ISS Catering
500.0
–
– –
–
2,100
238.1
ISS Israel Comprehensive Business
Services
52
2
Shultz Quality Catering 1997
320.0
–
– –
–
1,500
213.3
Shultz Yehiel Holdings
70
3
Idit Food Logistics
207.0
7.5
– –
-9.6
605
342.1
Dan Hotels
83
4
Zer Maadanim
148.0
-5.7
– –
–
600
246.7
–
95
5
Sodexo Israel
143.0
2.1
– –
–
760
188.2
SODEXO SA
97
6
Tamam
123.8
4.9
– –
3.4
370
334.6
El Al Israel Airlines
*
7
Moav
104.3
-2.8
– –
3.0
438
238.2
Bitan Wines Holdings
102
Company
Revenues
Net Profit
Equity
Employees
Parent Company
Main
Rank
2016
SERVICES
Profile
NIS
Millions
Change
(%)
NIS
Millions
Profitability
(%)
NIS
Millions
No.
Rev. per
Employee
NIS (000)
See
Page
rank 2016