


 563 / 730

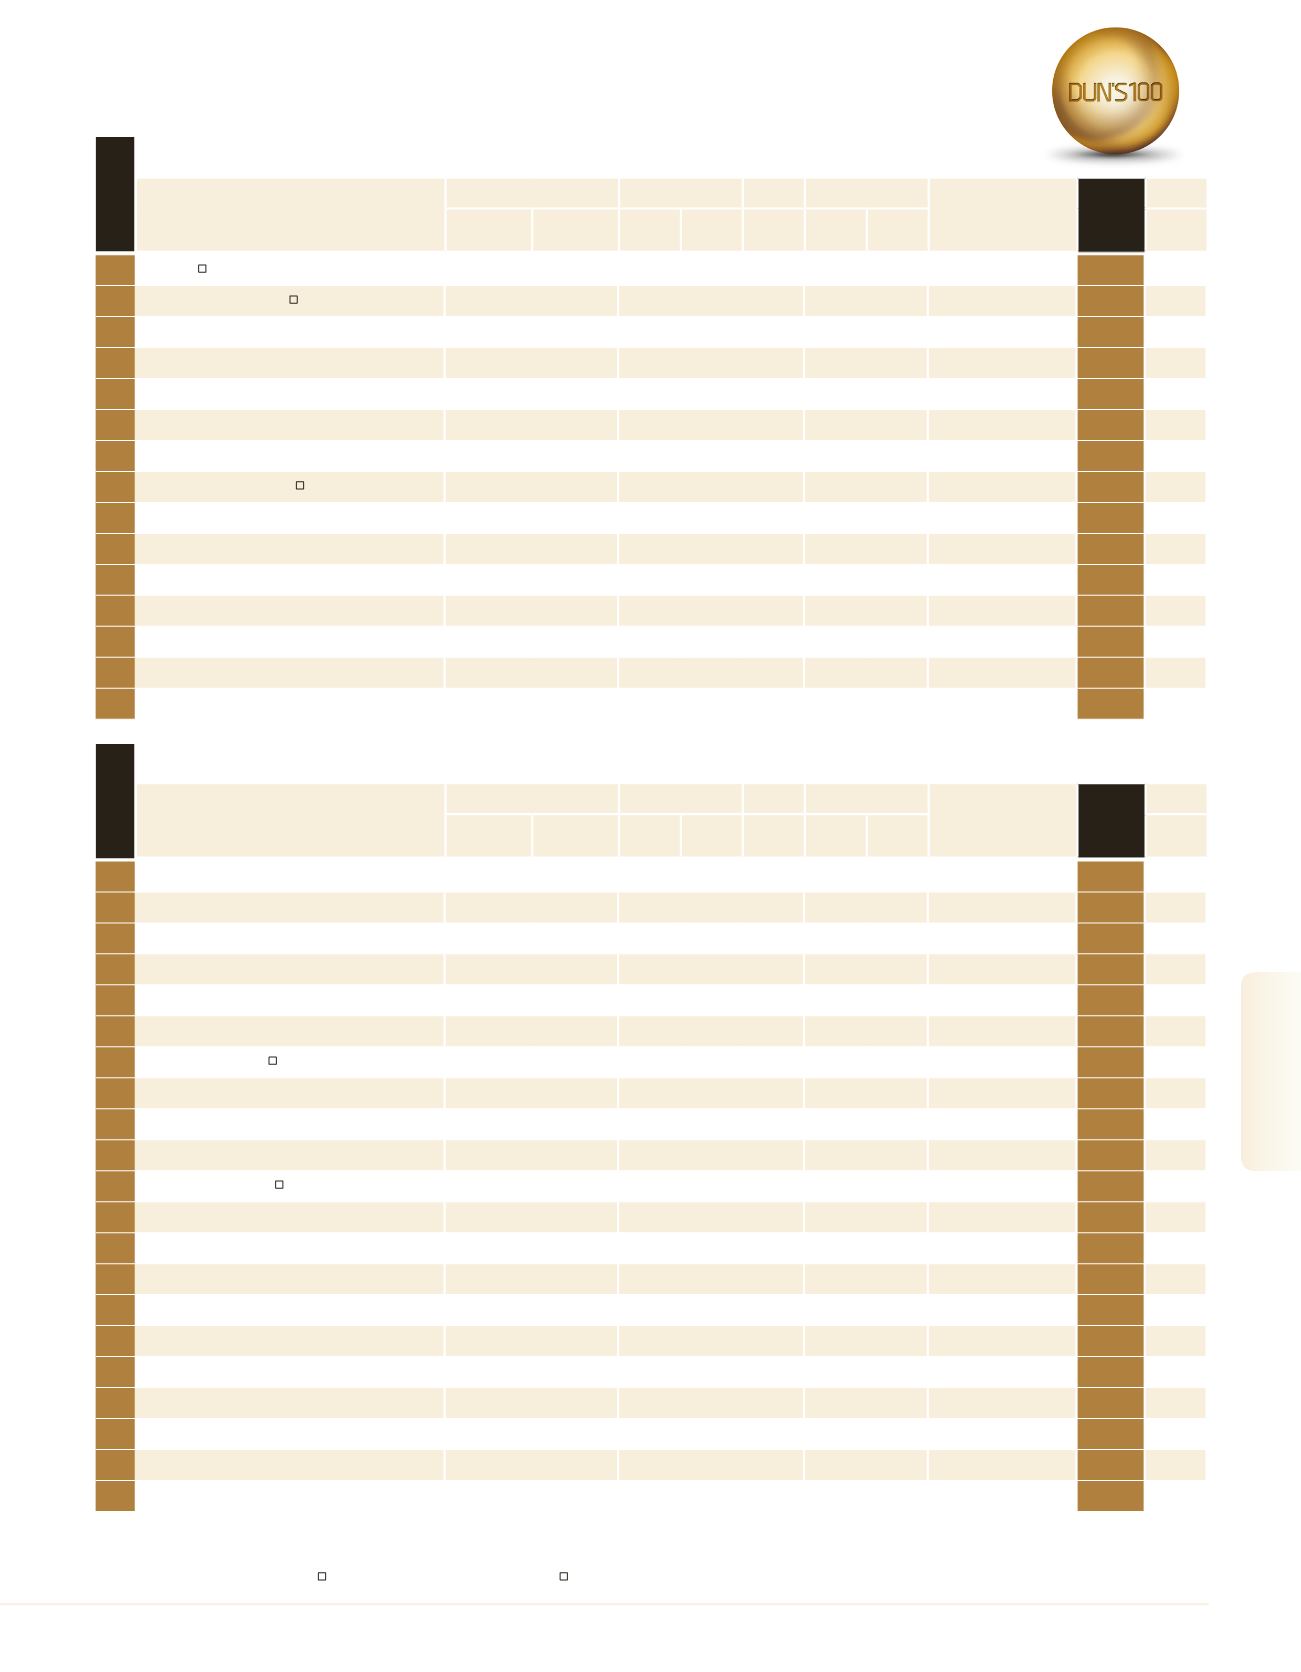
A subsidiary of a ranked company |
Company shares are traded in Israel |
Company shares are traded abroad |
Estimated figures
Food Retail
1
Shufersal
11,505.0
-0.8
150.0
1.3
1,161.0 13,506
851.8
Discount Investment
Corporation
2
564
2
Rami Levy - Chain Stores
3,982.4
16.8
74.3
1.9
331.9
4,990
798.1
–
10
565
3
Yeinot Bittan
2,900.0
13.7
– –
–
5,500
527.3
–
19
566
4
Marav Mazonkol
2,296.0
23.4
– –
–
1,350 1,700.7
–
22
5
Hatzi Hinam
1,700.0
–
– –
–
2,000
850.0
–
26
6
Tiv Taam Chains
1,053.0
10.7
– –
–
1,275
825.9
Tiv Taam Holdings 1
38
7
M. Johananoff
1,000.0
–
– –
–
1,300
769.2
–
40
8
Victory Supermarket Chain
979.4
9.1
16.3
1.7
162.4
1,752
559.0
–
41
9
Machsanei Hashuk
930.0
–
– –
–
1,400
664.3
Cohen Machsanei Hashuk
43
567
10
Coop Israel
820.0
–
– –
–
1,160
706.9
Co-Op Israel Aguda Zarhanit
Shitufit
53
568
11
Dor Alon Retail Sites Management
668.0
–
– –
–
–
–
Dor Alon
*
12
Super Dosh
500.0
–
– –
–
560
892.9
–
83
13
Almashadawe King Store
483.8
155.5
– –
–
970
498.8
–
86
14
Keshet Teamim
447.0
10.4
– –
–
820
545.1
–
92
15
Maadanei Menia
430.0
16.2
– –
–
420 1,023.8
–
94
Company
Revenues
Net Profit
Equity
Employees
Parent Company
Main
Rank
2016
Trade
Profile
NIS
Millions
Change
(%)
NIS
Millions
Profitability
(%)
NIS
Millions
No.
Rev. per
Employee
NIS (000)
See
Page
rank 2016
Wholesale Food And Beverages
1
Tal Hel Yasca
850.0
13.3
– –
100.0
300 2,833.3
–
50
2
Bicurei Hasade Darom
816.2
33.7
– –
162.3
582 1,402.4
–
54
3
Shintraco
813.7
1.9
– –
81.5
35 23,248.0
Proalim S.A
55
569
4
Sugat
800.0
–
– –
–
225 3,555.6
Sofpac B.V.
56
5
Leiman - Schlussel
585.0
14.7
– –
–
500 1,170.0
–
73
6
MasterFood
549.3
-5.4
– –
–
105 5,231.4
–
77
7
Hamama Meir Trading
484.6
-7.8
-15.2 -3.1
87.8
56 8,652.9
–
85
8
Bikorei Hasadeh Tzafon 1994
420.0
27.3
– –
–
330 1,272.7
–
97
9
Shukha
338.5
1.1
– –
–
65 5,207.7
Sons of George Shukha
111
10
M. Akkerman
332.0
5.4
– –
–
82 4,048.8
–
113
11
Willy Food Investments
313.0
-5.0
4.7
1.5
258.3
134 2,336.1
–
116
12
Hadiklaim
297.0
-13.3
– –
7.8
22 13,500.0
–
121
13
Ego Crops
250.0
-7.4
– –
–
100 2,500.0
–
133
14
Gali Moshe Boker Marketing & Packaging
250.0
–
– –
–
100 2,500.0
–
134
15
Nechemia Lachovitz
243.0
19.7
– –
–
30 8,100.0
–
137
16
Marina Mushrooms
230.0
–
– –
–
165 1,393.9
Mrina Galil Group
140
17
Glicksman Eggs Marketing
225.0
–
– –
–
110 2,045.5
–
142
18
Bar - Of
220.5
7.0
– –
–
7 31,500.0
–
143
19
Hacarem
208.5
-17.4
– –
–
133 1,568.0
–
148
20
Bnei Fouzi Samsum (2009)
200.0
–
– –
–
80 2,500.0
S.F.S Holdings & Trade
152
21
Field Produce
200.0
–
– –
–
65 3,076.9
Groundnuts & Cotton
Marketing
153
Company
Revenues
Net Profit
Equity
Employees
Parent Company
Main
Rank
2016
Trade
Profile
NIS
Millions
Change
(%)
NIS
Millions
Profitability
(%)
NIS
Millions
No.
Rev. per
Employee
NIS (000)
See
Page
rank 2016
563
2016
|
DUN’S
100
DUN’S
100
|
2016
DUN’S
100
|
2016
2016
|
DUN’S
100
Food Industry